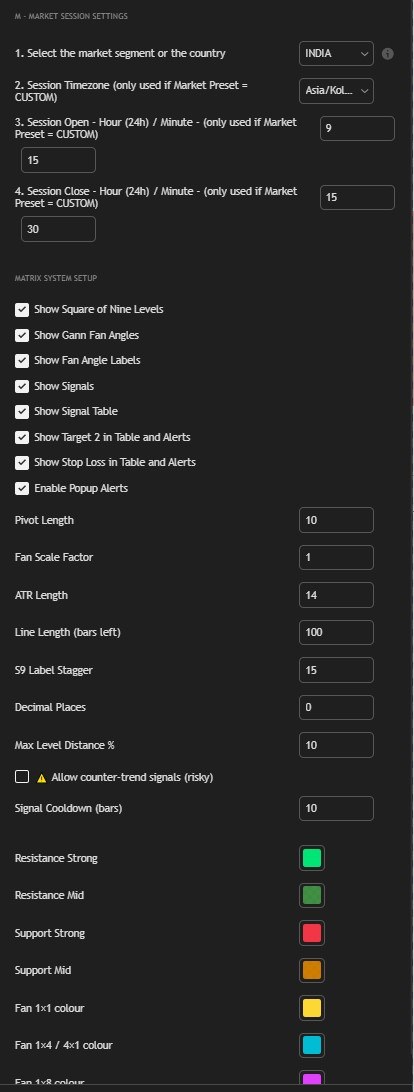
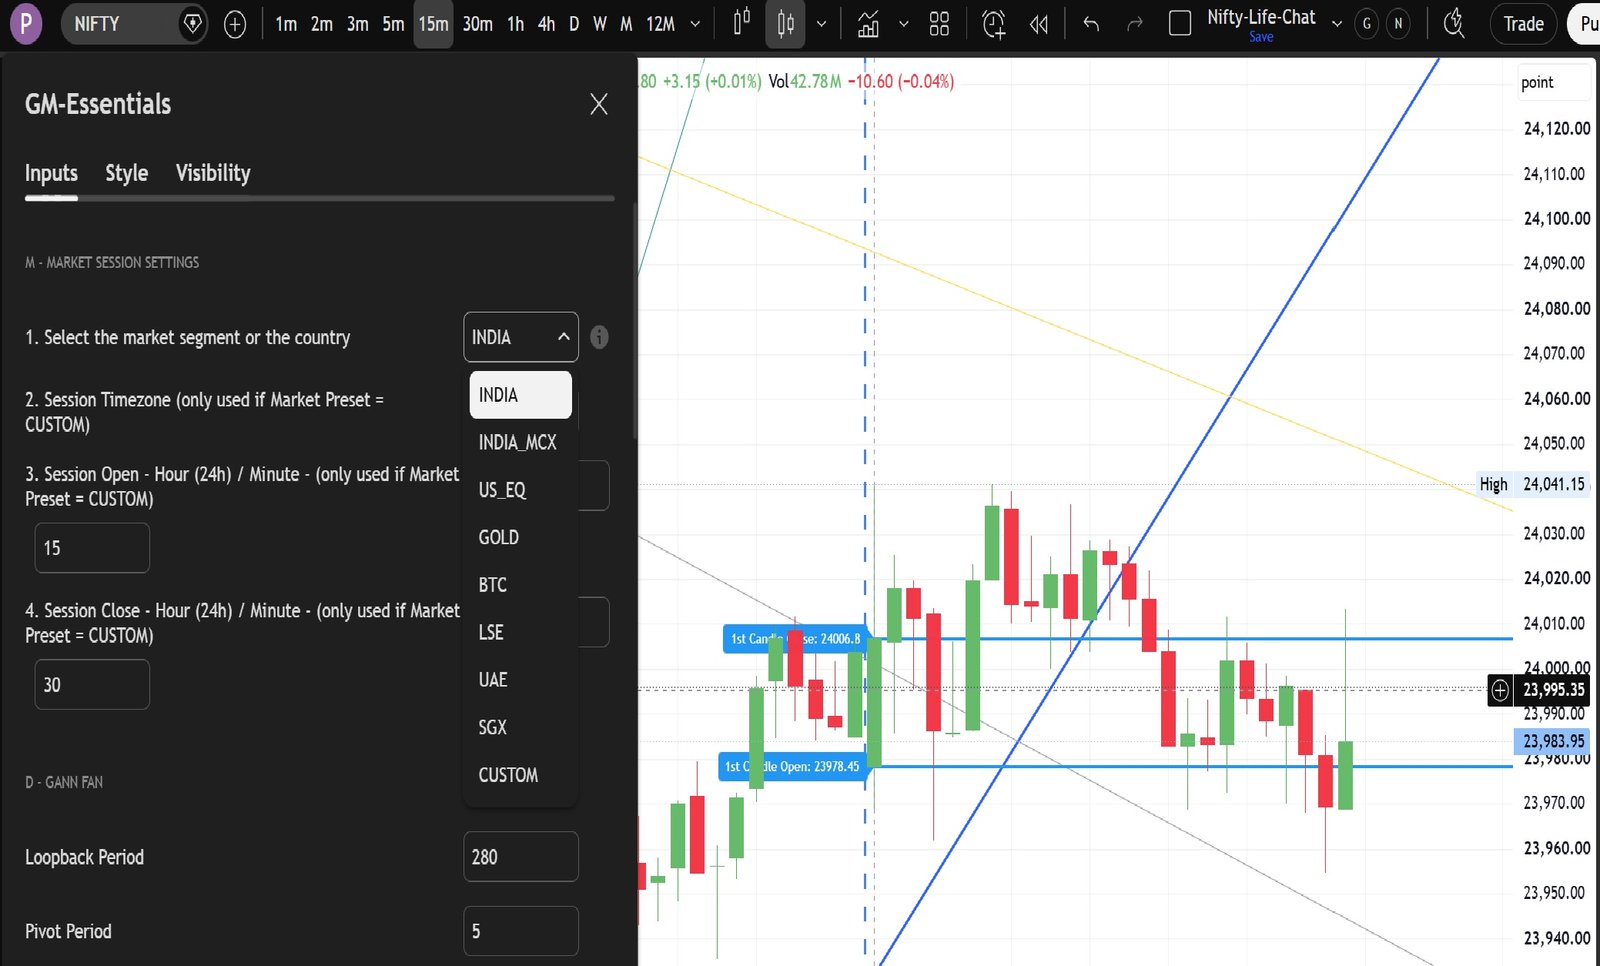
Every Gann Master indicator shares the same M — Market Session Settings input group. This tells the script your market's trading hours, so every time-based calculation across the indicator — session opens, first candle, degree divisions, and more — lines up correctly. Set this once per chart before using any indicator below.
- Market Preset: INDIA
- Timezone: Asia/Kolkata
- Session Open: 9:15
- Session Close: 15:30
- Select INDIA_MCX from the market segment or country dropdown list.
- To switch market segment or country, select it in the first dropdown.
- If your market segment or country is not listed, select CUSTOM.
- Provide inputs to Market Open — hour and minutes.
- Provide inputs to Market Close — hour and minutes.
Square of Nine — Price Level Projections
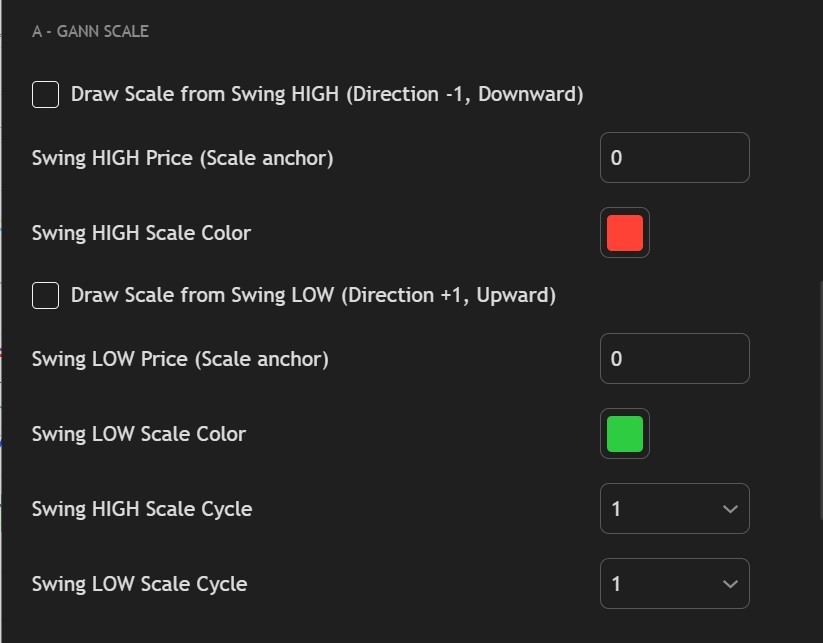
W.D. Gann's most powerful price tool. The Square of Nine is a spiral of numbers arranged geometrically — prices 90°, 180°, 270° or 360° apart on the spiral share a natural relationship. You enter your own swing high and swing low anchor prices, and the indicator projects 21 Gann angle levels from each, in both directions at once. These become your key support and resistance levels.
- Enter your own anchor prices — Swing HIGH and Swing LOW, each 0.00 to switch that side off
- Swing HIGH anchor projects downward (Direction −1); Swing LOW projects upward (Direction +1)
- 21 angle levels from 0° to 450° in 22.5° steps
- Each anchor has its own colour; every level labelled with angle + price
- Scale Cycle per anchor: 1×, 10×, 100×, 1,000×, 10,000× or 100,000×
- The cycle multiplier makes it work on Nifty, BankNifty, stocks, Gold, Forex and crypto alike
- Both anchors run simultaneously and independently
- Fully independent of every other section
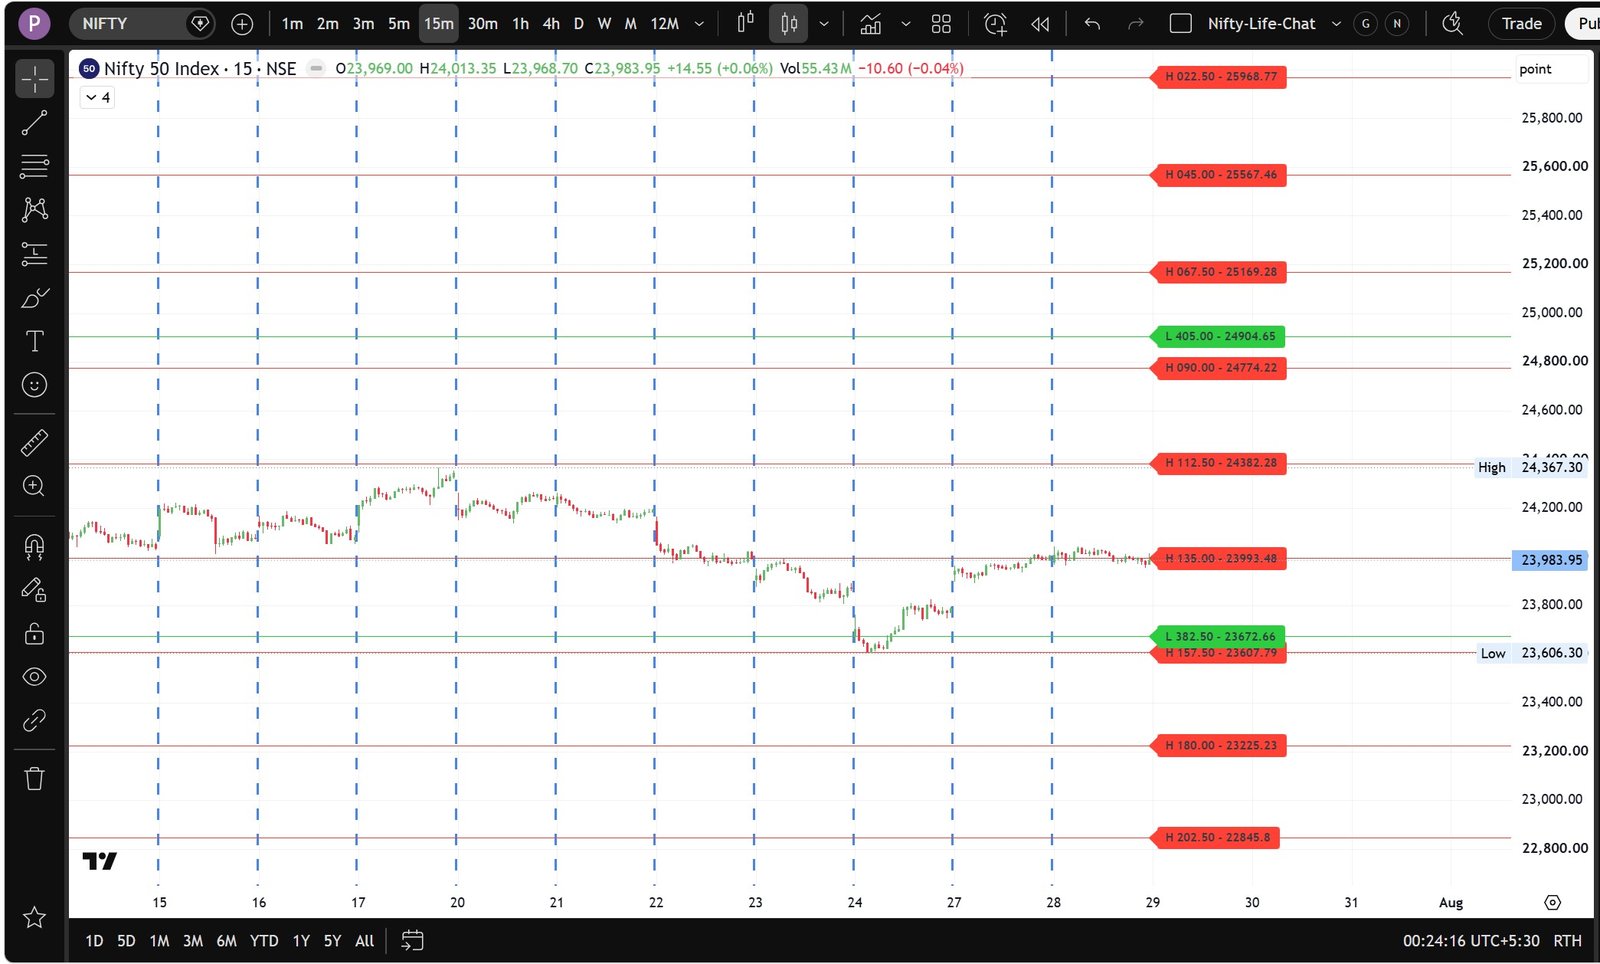
Three Fibonacci Modes + Gann Law of Vibration
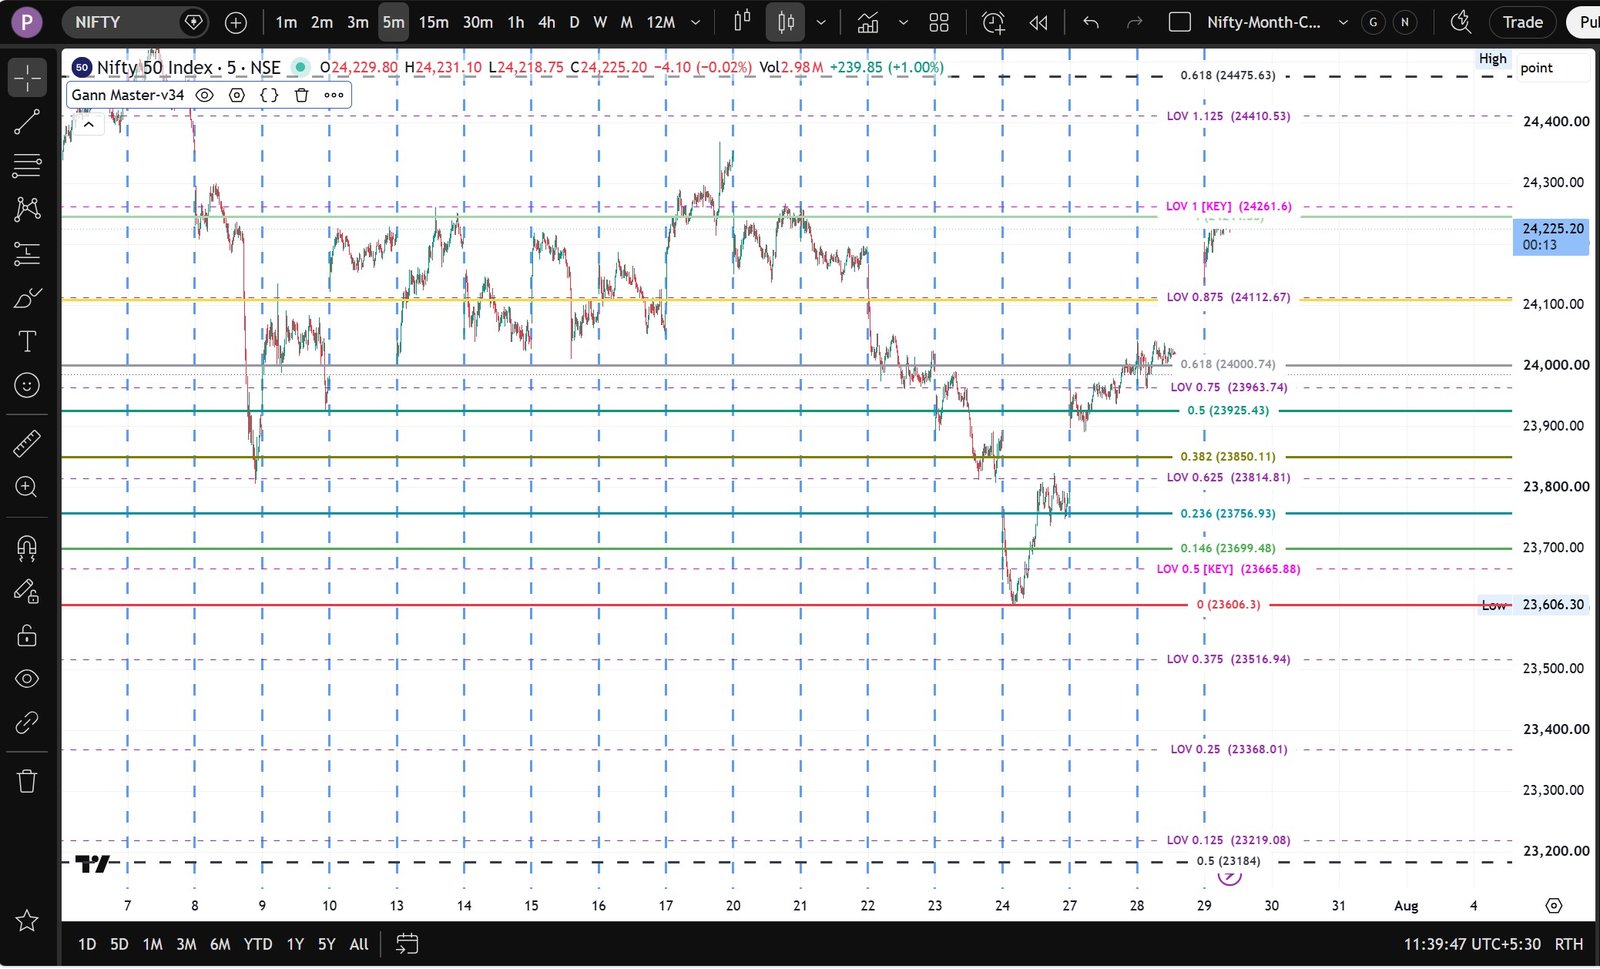
Three independent drawing modes that can all run at once: real Fibonacci sequence levels drawn from the actual Fibonacci numbers nearest to price, standard high/low retracement levels, and Gann's Law of Vibration — 25 harmonic price levels in 1/8 steps from a reference candle you nominate. Proximity alerts fire on bar close when price comes within 0.5% of the 50% or 61.8% level, on either Fibonacci mode.
- Real Fibonacci sequence: 1, 2, 3, 5, 8, 13, 21… numbers
- H/L retracement: 14.6%, 23.6%, 38.2%, 50%, 61.8%, 78.6%
- Law of Vibration: 25 levels in 1/8 steps (0.000 to 3.000)
- Four alerts — 50% and 61.8%, separately for the sequence and the H/L modes
- Alert tolerance is a 0.5% band around the level, evaluated on bar close
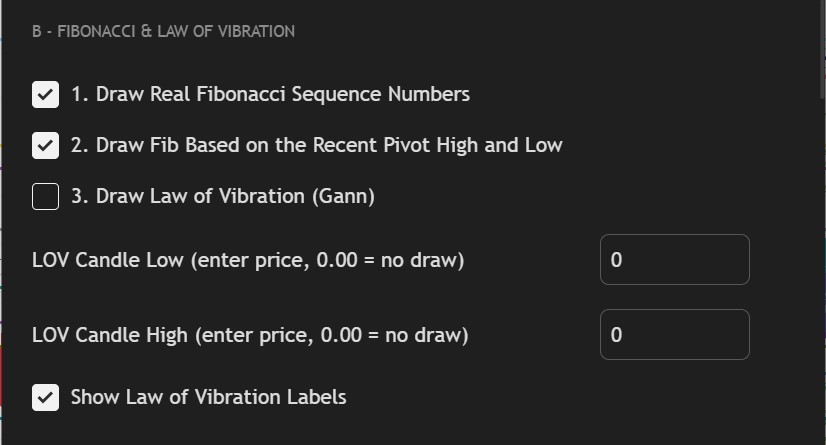
- Manual Low and High price input for the Law of Vibration reference candle
- Law of Vibration labels can be toggled on or off
- All three modes fully independent — use any combination, LOV is off by default
Gann Odd & Even Square Levels
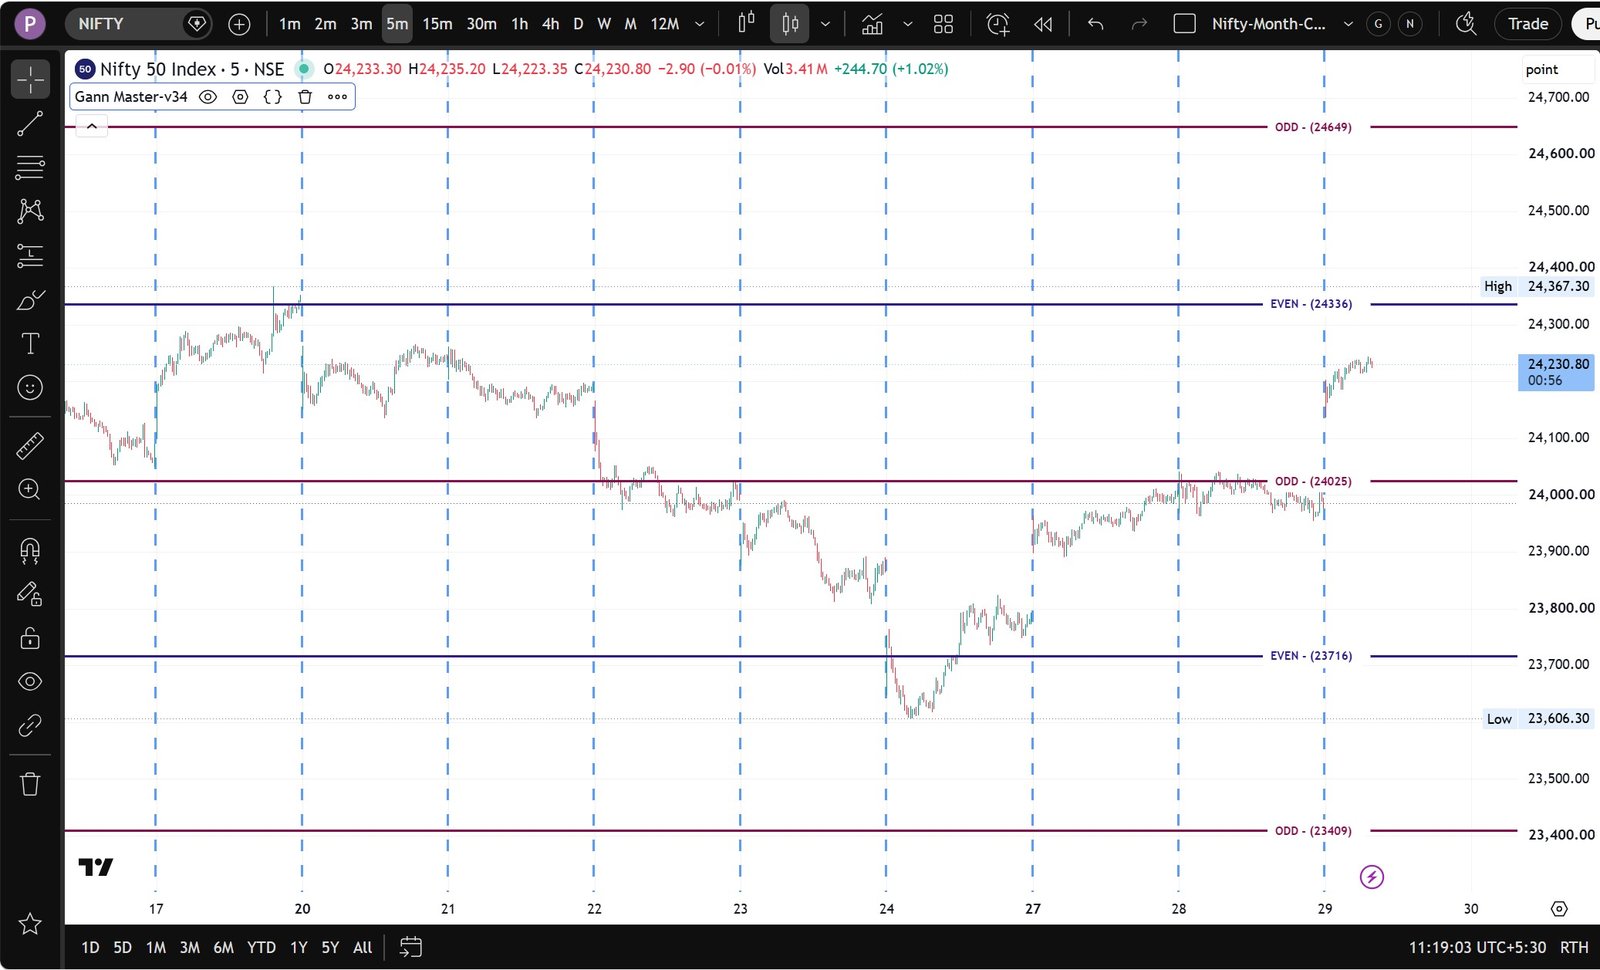
Gann's odd and even square numbers (1², 2², 3²…) act as natural price magnets. The indicator takes the square root of the current close, finds the nearest whole square, then projects a ladder of squares above and below it. Odd squares — where half the square ends in .5 — are drawn in maroon; even squares in navy, giving an instant visual map of the nearest Gann square numbers.
- Auto-detects the nearest square from the current close — no input needed
- Projects six squares upward and six downward from that starting square
- Odd squares (maroon) — half the square ends in .5
- Even squares (navy) — half the square is a whole number
- Every level extended both ways and labelled ODD or EVEN with its value
- Scale-free: works at any price level, on any market
- Drawn once on the last confirmed bar, so it never clutters historical bars
- Single on/off toggle — no configuration required
Auto Gann Fan from Swing Highs and Lows
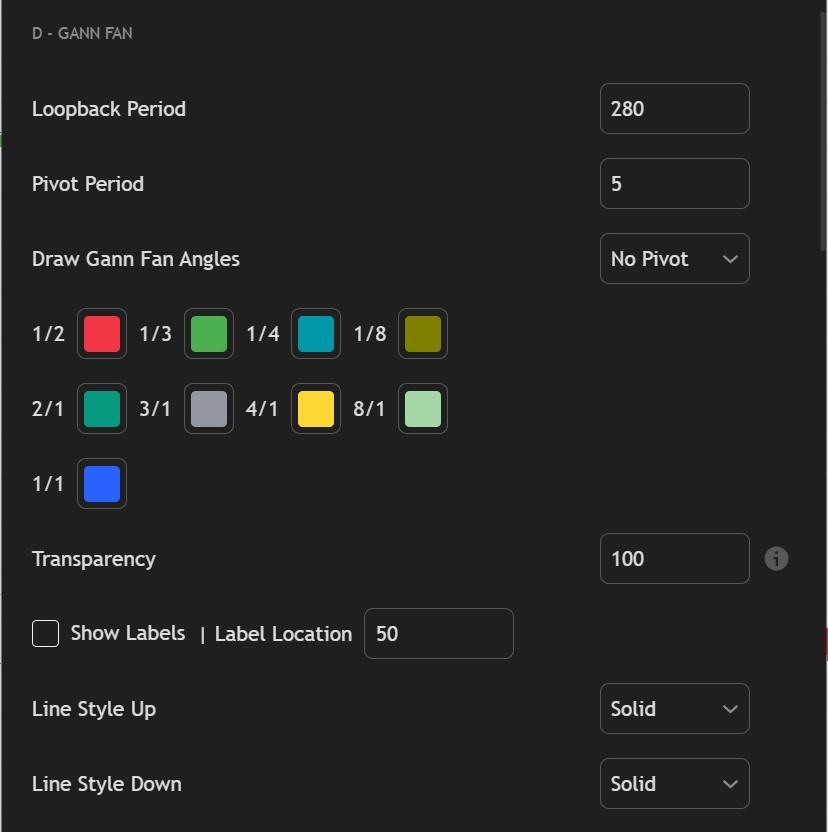
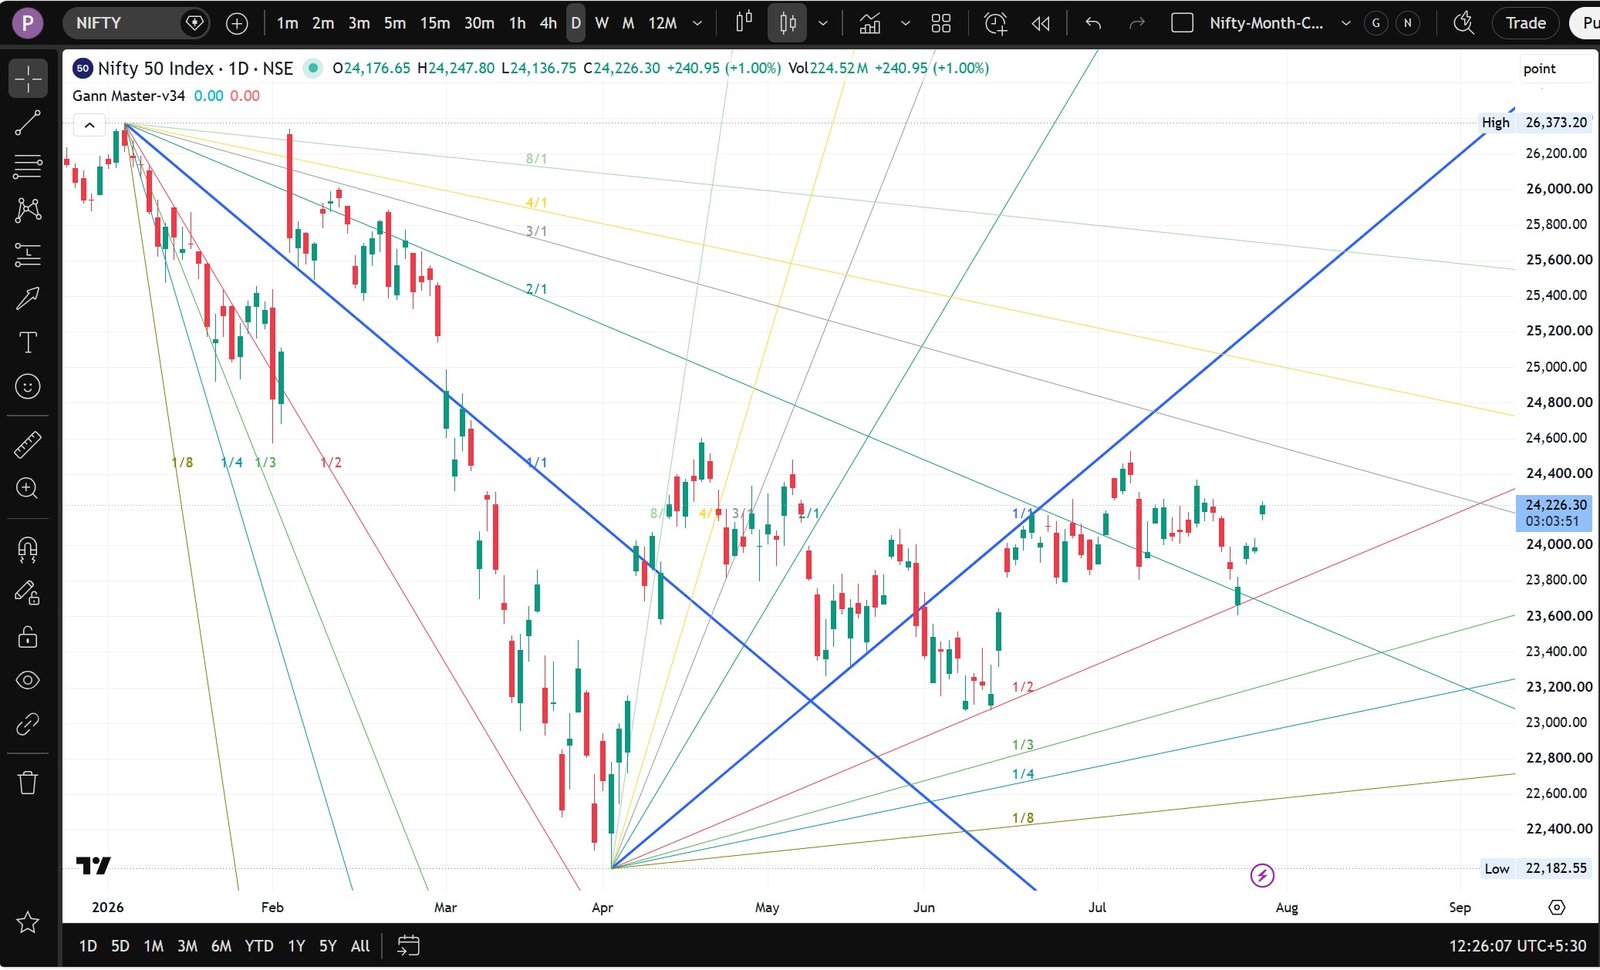
The Gann Fan radiates 9 angle lines from a dominant pivot, with the all-important 1×1 (45°) line drawn thicker. Markets in uptrend ride the 1×1 — breaking below it signals reversal. Choose whether to fan from the top pivot, the bottom pivot, or both at once; the fan is off until you pick, so it never clutters a chart you did not ask it to. Angles update automatically as new pivots form.
- Four modes: No Pivot (default, off), Both Pivot, Top Pivot, Bottom Pivot
- 9 fan angles: 1/2, 1/3, 1/4, 1/8, 1/1, 2/1, 3/1, 4/1, 8/1
- Automatic pivot detection once a mode is chosen — no price to type in
- Loopback Period (default 280) and Pivot Period (default 5) controls
- Optional shading between angle pairs — set Transparency below 100 to reveal it
- Independent line style for the up and down fans: Solid, Dashed or Dotted
- Angle labels toggleable, with placement from 1 to 300 bars from the pivot
- Each angle carries its own fixed colour so the 1×1 stays recognisable
Gann Solar Date Markers & Custom Cycle Projections
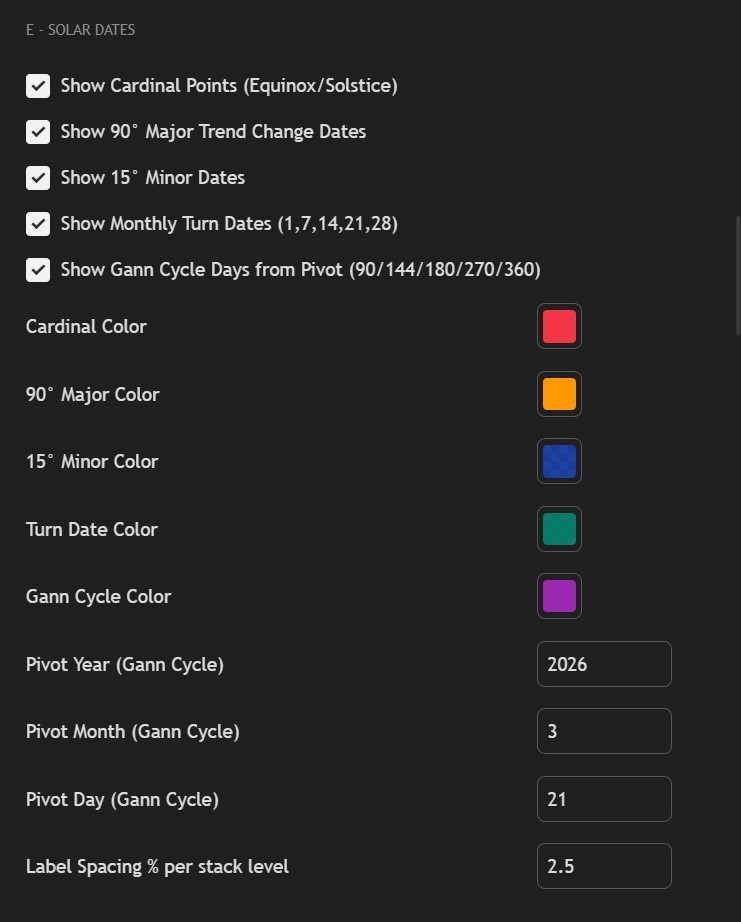
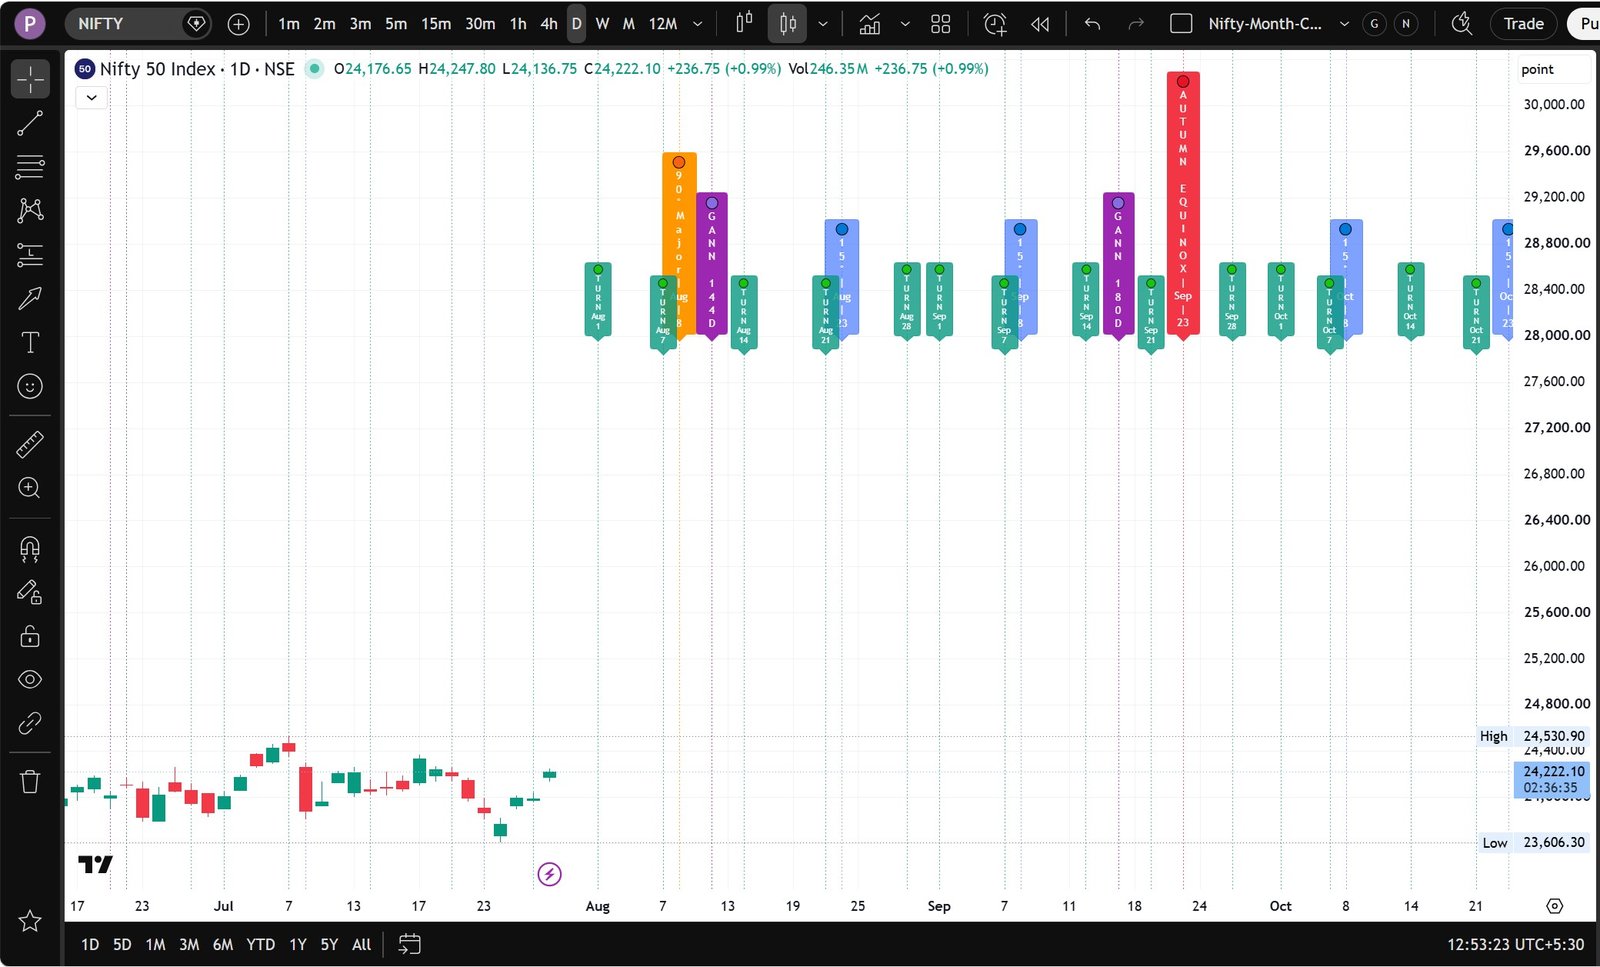
W.D. Gann placed great importance on natural time cycles derived from the sun's position. The indicator marks the four Cardinal Points (equinoxes and solstices — Gann's strongest reversal dates), 90° major trend-change dates, 15° minor sentiment-shift dates, monthly turn dates, and custom Gann cycle days counted from any pivot you specify. All dates are plotted for the current calendar year.
- Cardinal Points: Mar 21, Jun 21, Sep 23, Dec 21
- 90° major dates: Feb 4, Jun 6, Aug 8, Dec 7
- 15° minor dates: 17 dates spread through the year
- Monthly turn dates: the 1st, 7th, 14th, 21st and 28th of every month
- Custom pivot: enter year, month and day for the cycle start
- Gann 90/144/180/270/360-day projections forward from that pivot
- Every date drawn as a vertical line with a stacked vertical label; overlapping labels auto-stack, spacing adjustable
- Five colour controls — Cardinal, 90° Major, 15° Minor, Turn Date and Gann Cycle
- Alerts: Cardinal Point and Monthly Turn Date
- All five date families toggle independently; plotted for the current year
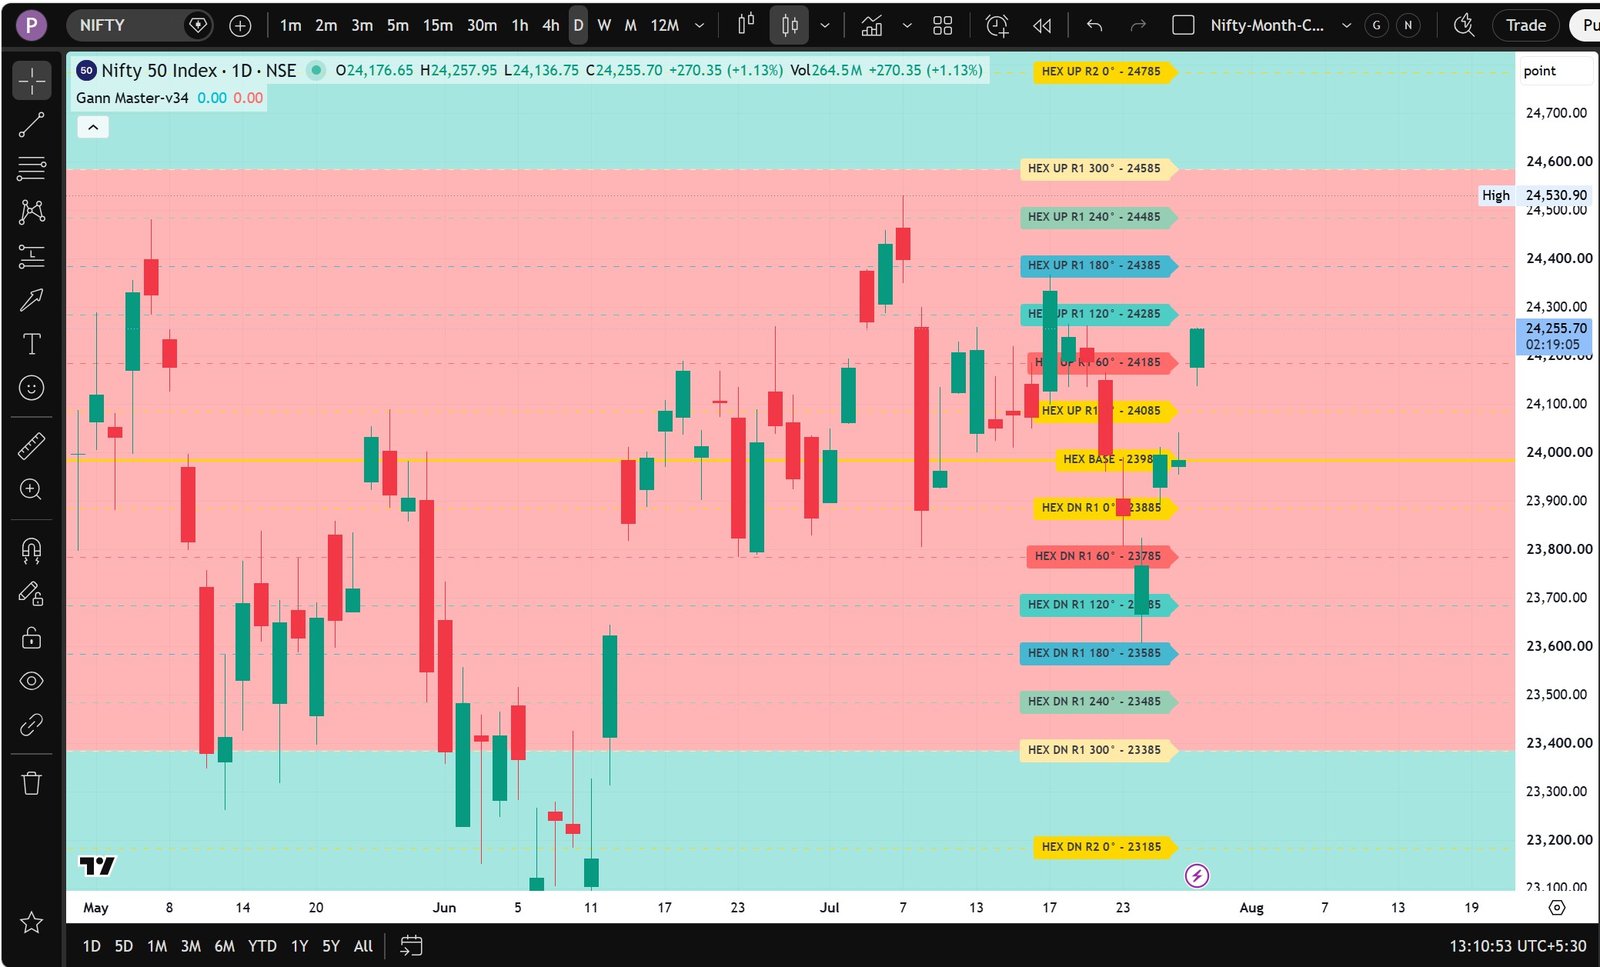
Gann's Hexagonal Price Spiral — Support & Resistance Clusters
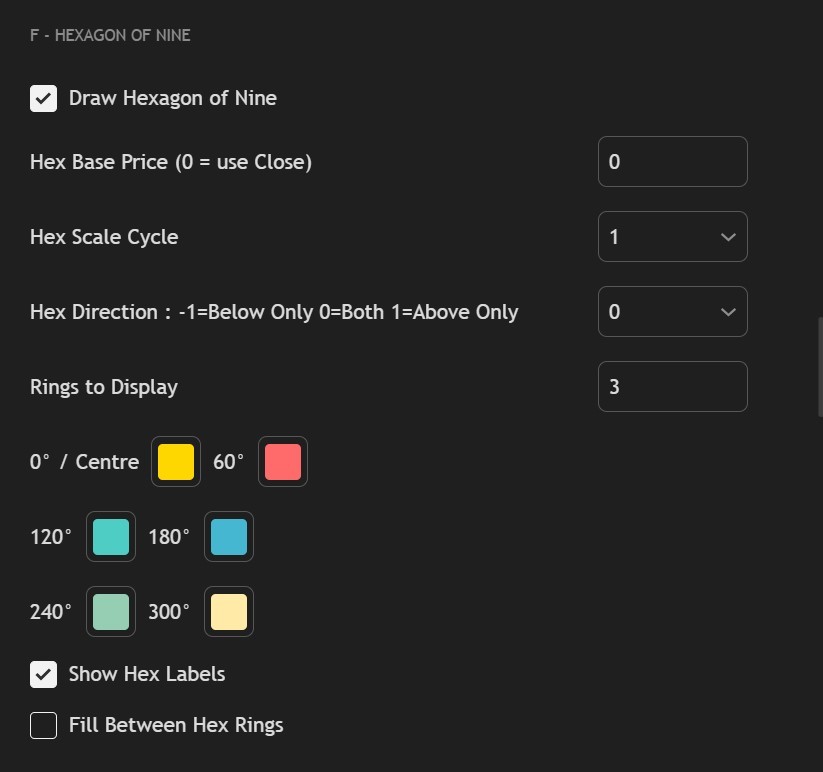
The Hexagon chart is a lesser-known Gann tool where numbers spiral outward in a hexagonal pattern, each ring adding 6 to the previous increment. The indicator locates which hexagon ring the current price falls in, then projects the 6 cardinal hexagon price levels (0°, 60°, 120°, 180°, 240°, 300°) as horizontal lines above and below. These cluster with Square of Nine levels to mark high-confidence zones.
- 1 to 6 rings, projected above and/or below the current price
- 6 cardinal angles per ring: 0°, 60°, 120°, 180°, 240°, 300°
- Direction control: below only (−1), both (0), or above only (1)
- Optional fill between rings for subtle zone shading, with its own transparency control
- Hex Scale Cycle: 1×, 10×, 100×, 1,000× or 10,000× for any price scale
- Manual base price, or leave at 0.00 to anchor automatically from the current close
- Separate colour control for each of the 6 angles
- Labels show ring number, angle and price value — toggleable
The Classic Gann Box — Price & Time in Balance
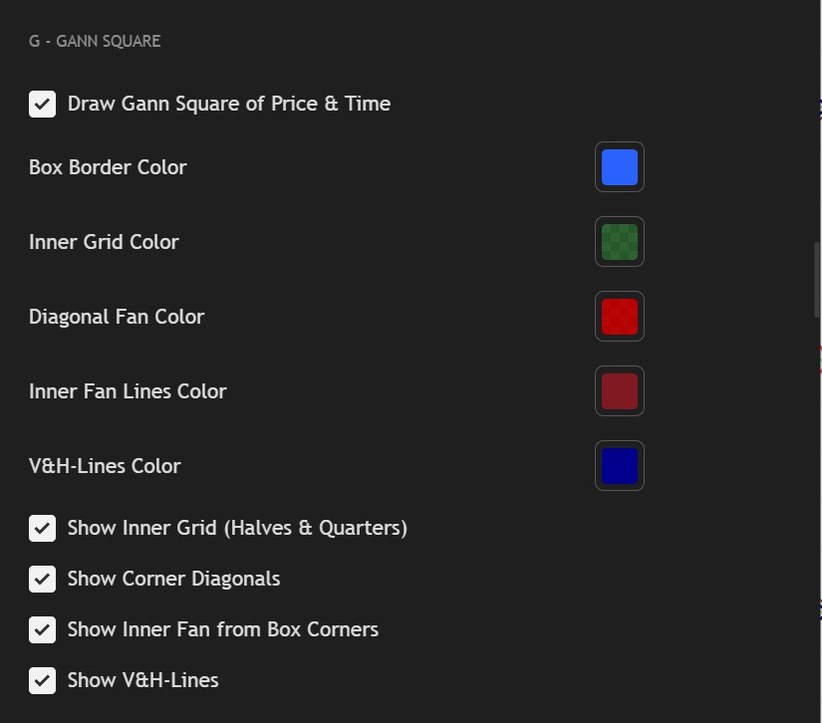
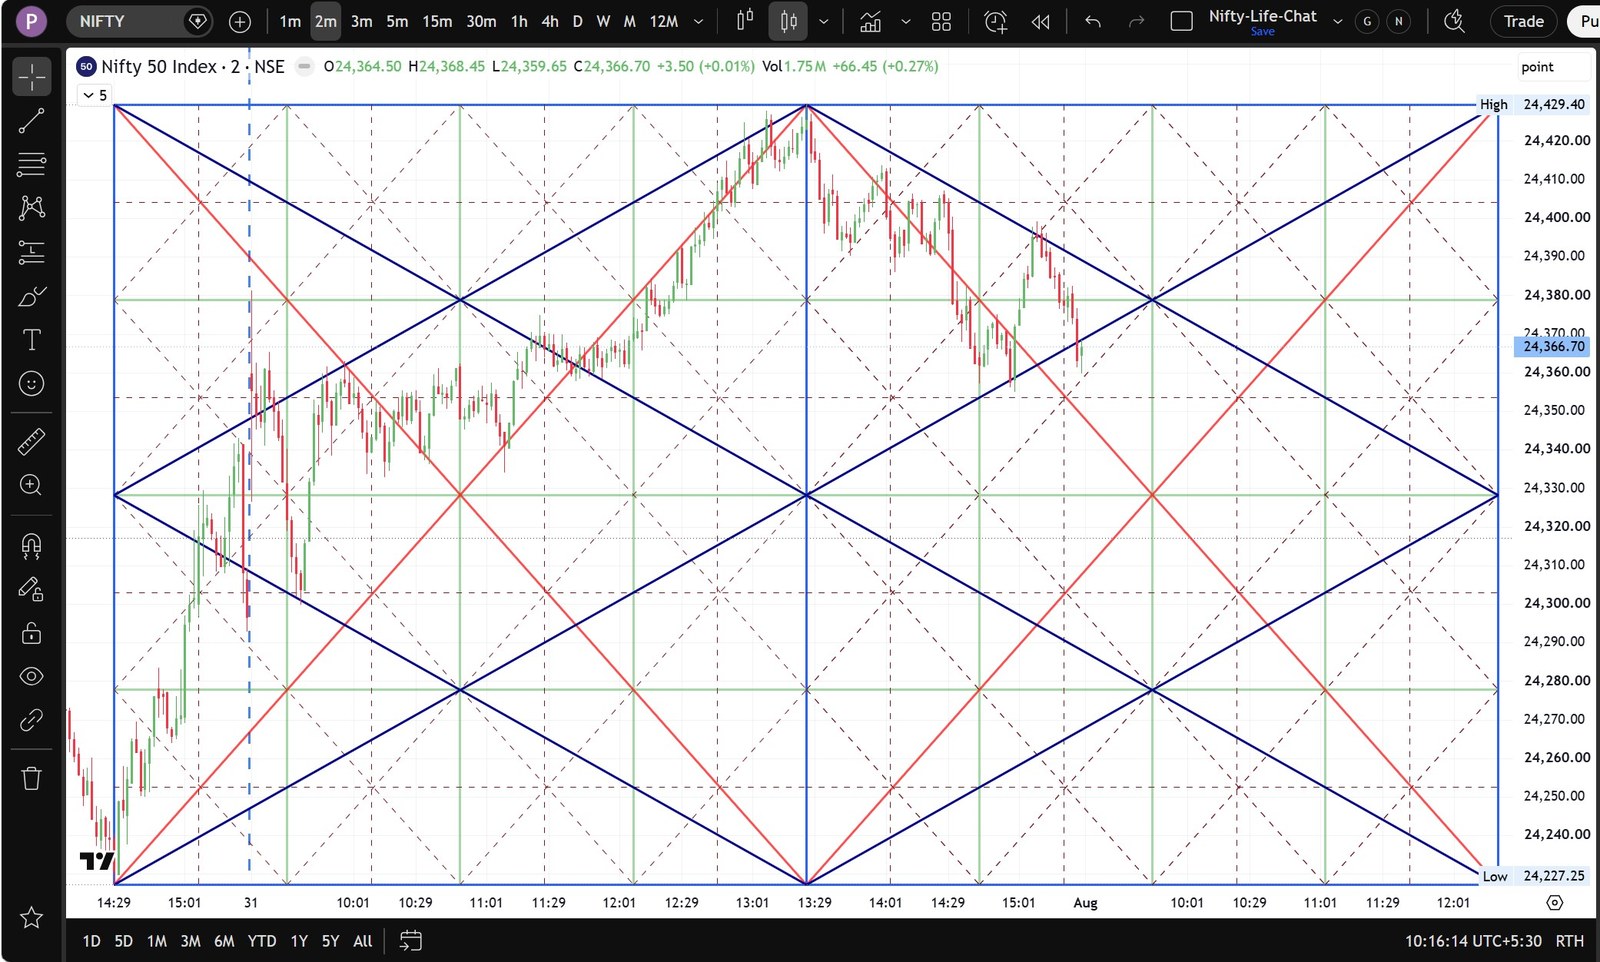
Gann's Square of Price & Time is a rectangle whose width in bars equals its height in price. When price and time “square out,” reversals become likely. The indicator builds the box from the swing high and the swing low simultaneously, subdivides it into halves and quarters both ways, then adds corner diagonals, V&H lines and a full inner fan. Boxes chain forward automatically as time advances past the right edge.
- Automatic high and low anchor detection — two independent box chains
- Inner grid: halves and quarters, 3 horizontal + 3 vertical lines per box
- Corner diagonals across both box axes
- Inner fan: every one of the 16 grid cells carries both diagonals plus centre lines, promoting the quarter grid to a full eighth grid
- V&H lines from the corners to the opposite mid-points
- Boxes chain automatically as price and time advance
- Anchors re-lock when a genuinely new swing high or low forms
- Separate colours for box border, inner grid, corner diagonals, inner fan and V&H lines
- Each of the four line families toggles independently
Previous Quarter, Month, Week & Day High/Low
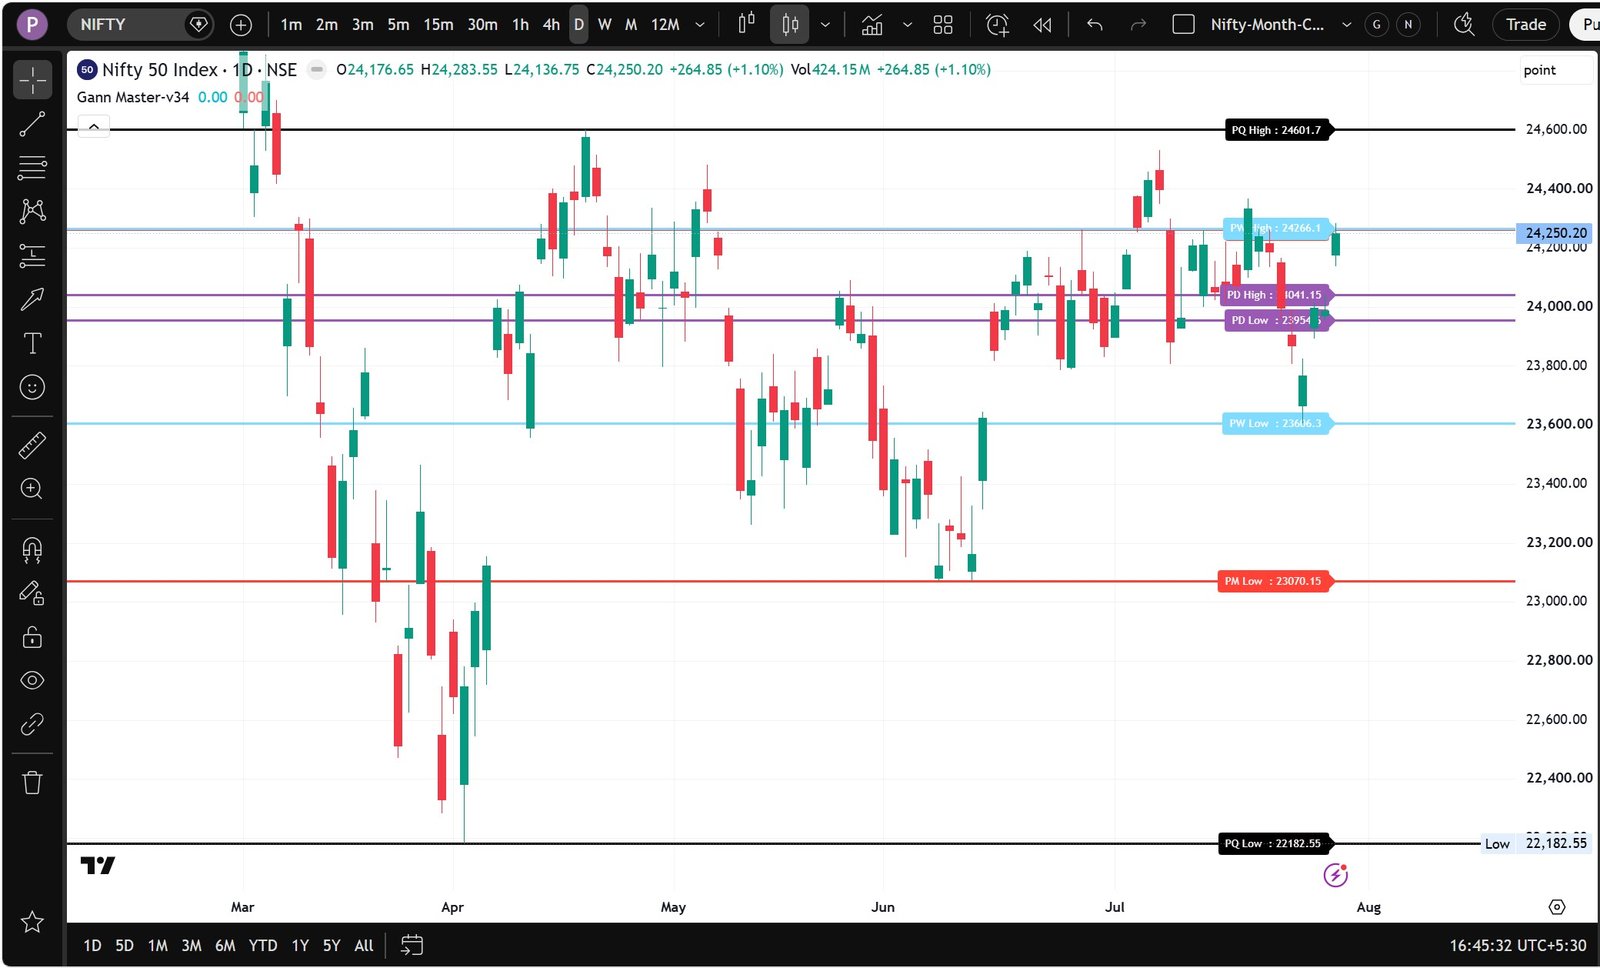
Horizontal reference lines for the previous Quarter, Month, Week and Day high and low — among the most respected support and resistance levels in institutional trading. Each is drawn as an extended horizontal line with a label showing the exact level, and redrawn on every new bar so the labels always sit at the chart's current right edge. No staircase effect.
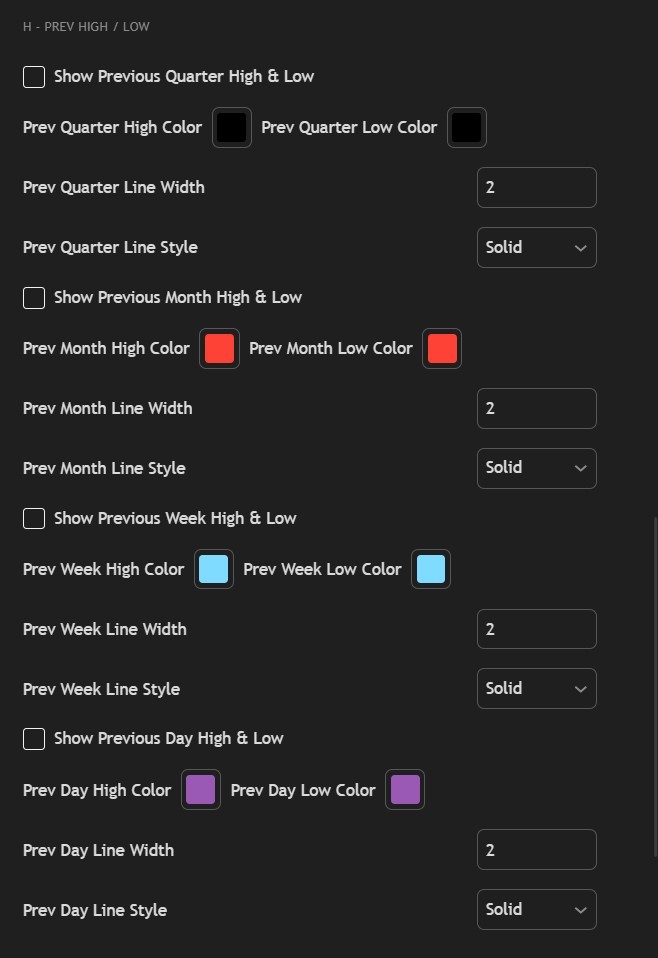
- Previous Quarter High & Low — black, solid, width 2
- Previous Month High & Low — red, solid, width 2
- Previous Week High & Low — light blue, solid, width 2
- Previous Day High & Low — purple, solid, width 2
- Independent high and low colour for every period
- Independent line width and style per period: Solid, Dashed or Dotted
- Labels read PQ / PM / PW / PD, High or Low, with the price
- Each of the four periods toggles independently
Gann Degree Divisions + Squares & Master Numbers from Session Open
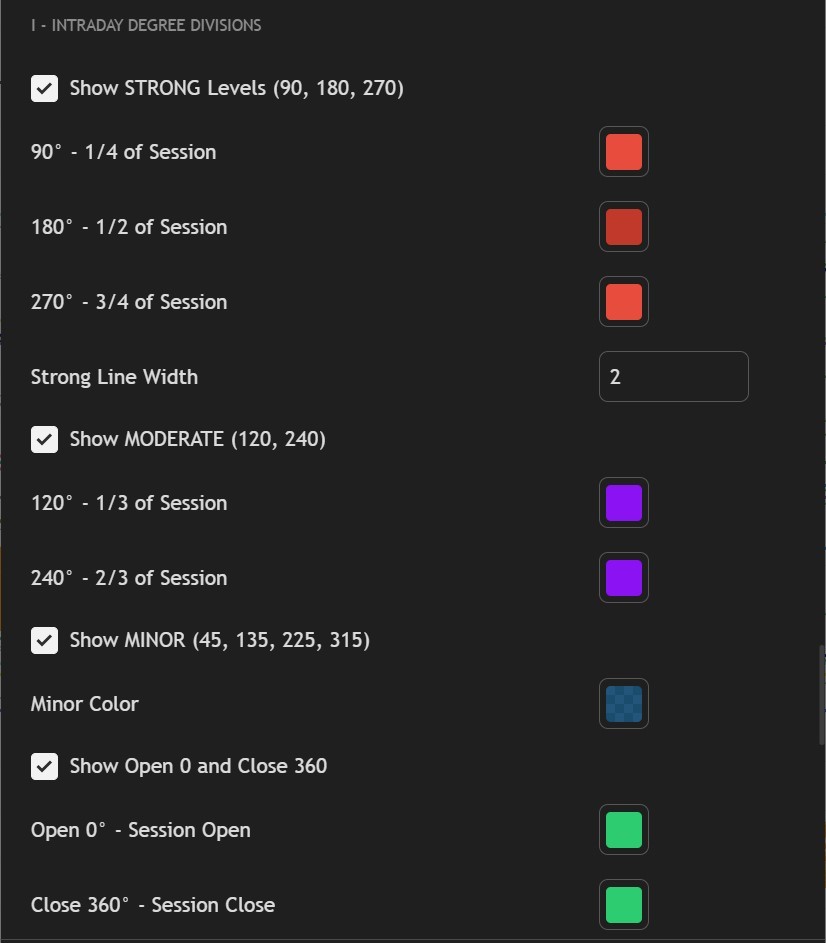
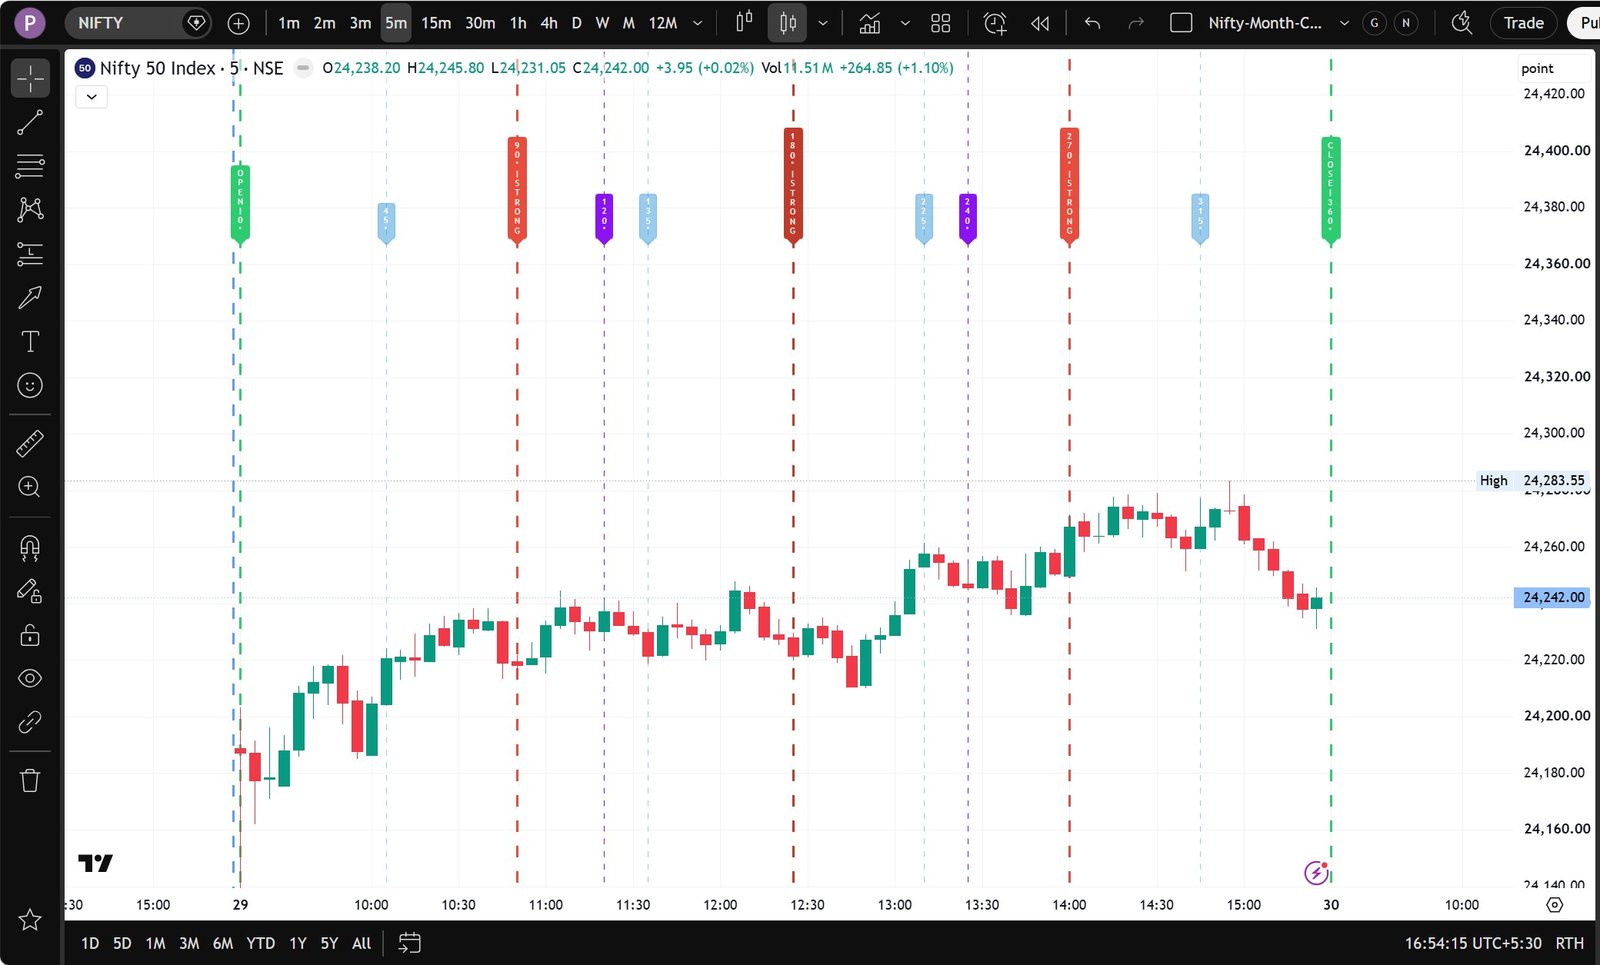
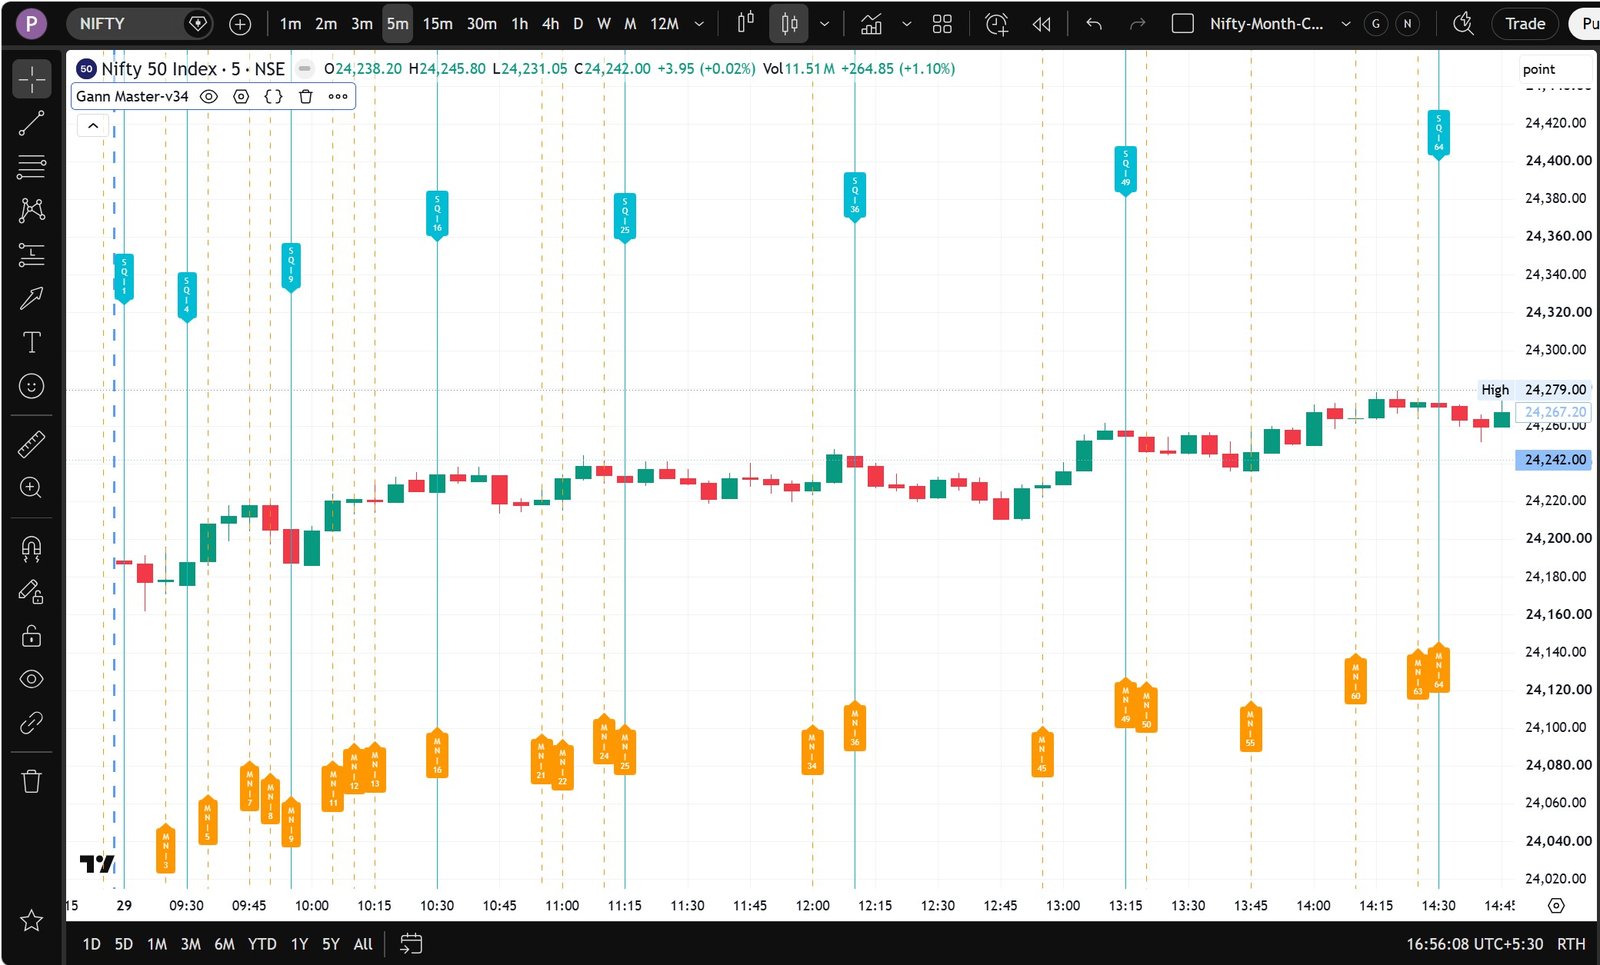
A comprehensive intraday time tool. It divides the trading session into Gann degree windows (45°, 90°, 120°, 135°, 180°, 225°, 240°, 270°, 315°, plus the 0° open and 360° close) as vertical time markers, and simultaneously counts Gann Square numbers and Master Numbers as bar counts from the session open. Market presets make it work on any exchange, not just NSE.
- Market presets: NSE India, Indian MCX, US Equity, Gold, Bitcoin, LSE, UAE, Singapore, or fully custom session hours
- STRONG windows — 90°/180°/270° (quarter, half and three-quarter session)
- MODERATE windows — 120°/240° | MINOR windows — 45°/135°/225°/315°
- Separate toggle for the 0° session open and 360° session close markers
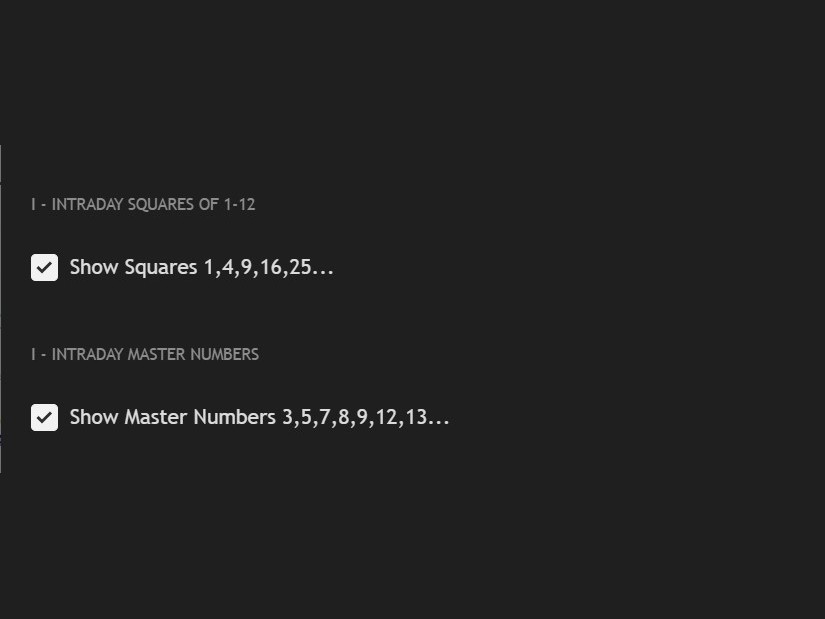
- Squares (1, 4, 9, 16, 25…) and Master Numbers (3, 5, 7, 8, 9, 12, 13…) counted from the session open
- Projects yesterday, today and tomorrow simultaneously
- Alerts: Gann Square number bar reached, Gann Master number bar reached
- Independent colours and line widths for the strong, moderate, minor and open/close families
Magic T — Terry Laundry's Time Symmetry Rule
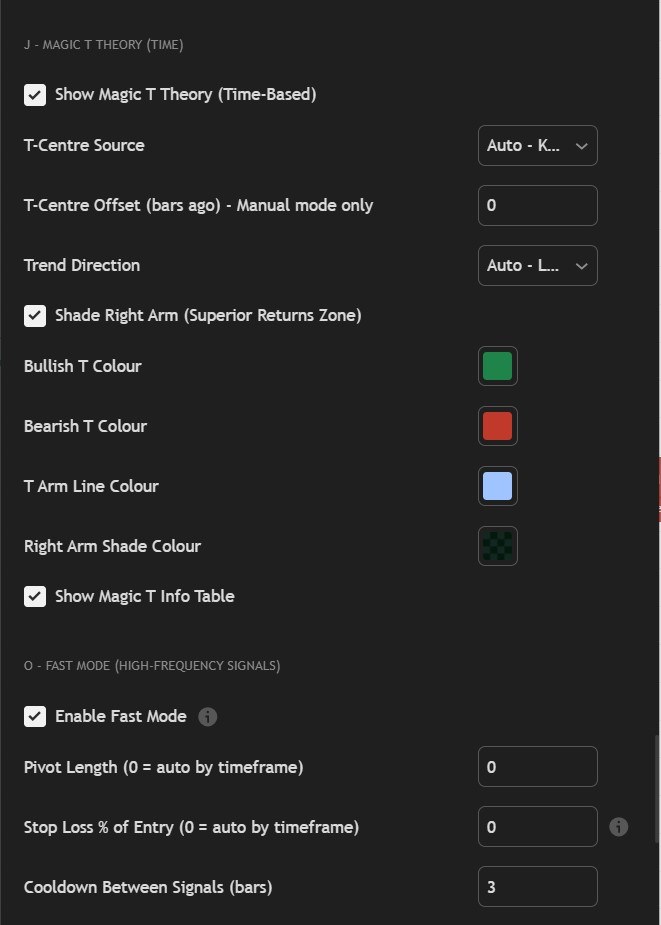
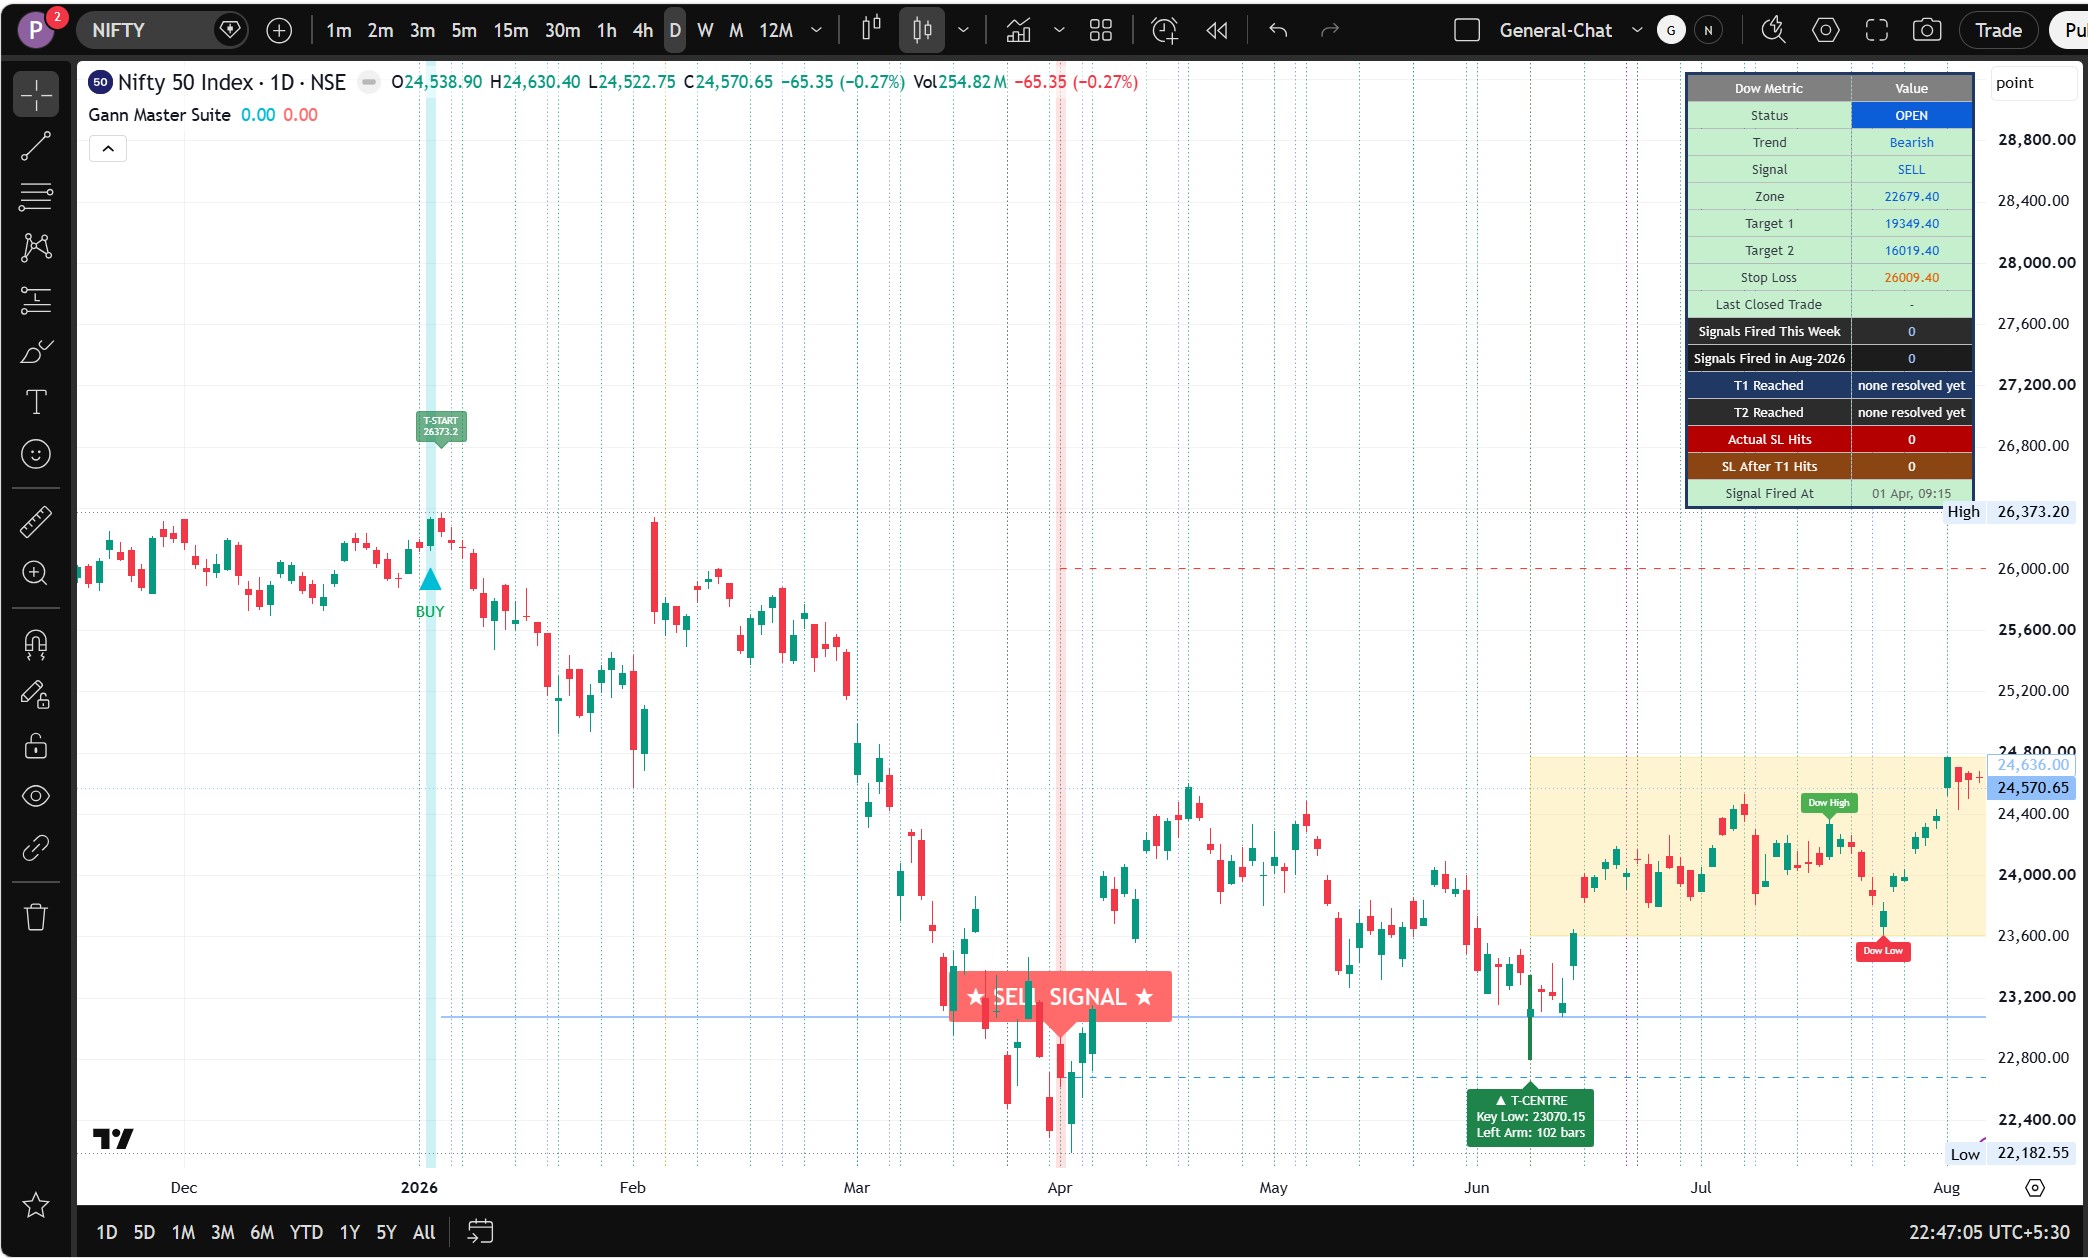
Magic T Theory is not W.D. Gann's work, and the credit belongs elsewhere: it was discovered in the early 1970s by Terrence Laundry, an MIT-trained engineer turned money manager, who named the underlying principle the Law of Matched Trend Time. It states that whatever time a market spends building toward a turning point tends to be matched by the time it spends running away from it. Our indicator auto-detects the key swing high → swing low (the Left Arm, ending at what Laundry called the centre post), then projects that same bar-count forward to mark the predicted T-Top — a time prediction, not a price one. A shaded "superior returns zone", Laundry's own term, highlights the unfolding Right Arm up to that projection. Magic T is also the timing half of the signal engine: when the projected T-Top is reached and Dow Theory confirms a genuine break of structure, Group L fires a live BUY or SELL with a full Entry / Stop Loss / Target 1 / Target 2 plan — switch Magic T off and those signals stop entirely. Group O, Fast Mode, is deliberately separate: it trades pure pivot structure with no time cycle at all, so it runs independently and nothing in this group affects it. These signals are educational analysis tools, never a guarantee — a valid cycle can still fail, and past performance does not guarantee future results.
- Discovered by Terrence Laundry in the early 1970s — a time-cycle method, not one of Gann's
- Auto T-Centre detection from the key swing low (Laundry's "centre post")
- Manual T-Centre override (enter exact bars-ago offset)
- Left Arm (high→low) and Right Arm (low→now) duration in bars
- T-Top projection line — the predicted reversal bar, with a live countdown reading "PASSED" once negative
- Anchor locking — once a cycle is found it stays put, and its values persist until a genuinely new cycle replaces them
- Phase readout: Left Arm (Cash Buildup) → Right Arm (Run Phase, % complete) → T Complete
- Predicted Bias — derived from a real Dow swing-structure break, not from the time cycle itself
- Shade Right Arm — highlights the "superior returns zone"
- Magic T info table: T-Start, T-Centre, Left Arm, Right Arm, Bars to T-Top, Completion %, Predicted Bias, Phase
- Alerts: T-Top Approaching (≤5 bars), T-Top Reached, Right Arm 75% complete
- Required by Group L's BUY/SELL signals; Group O Fast Mode runs entirely independently
First Candle Open & Close — The Day's Reference Lines
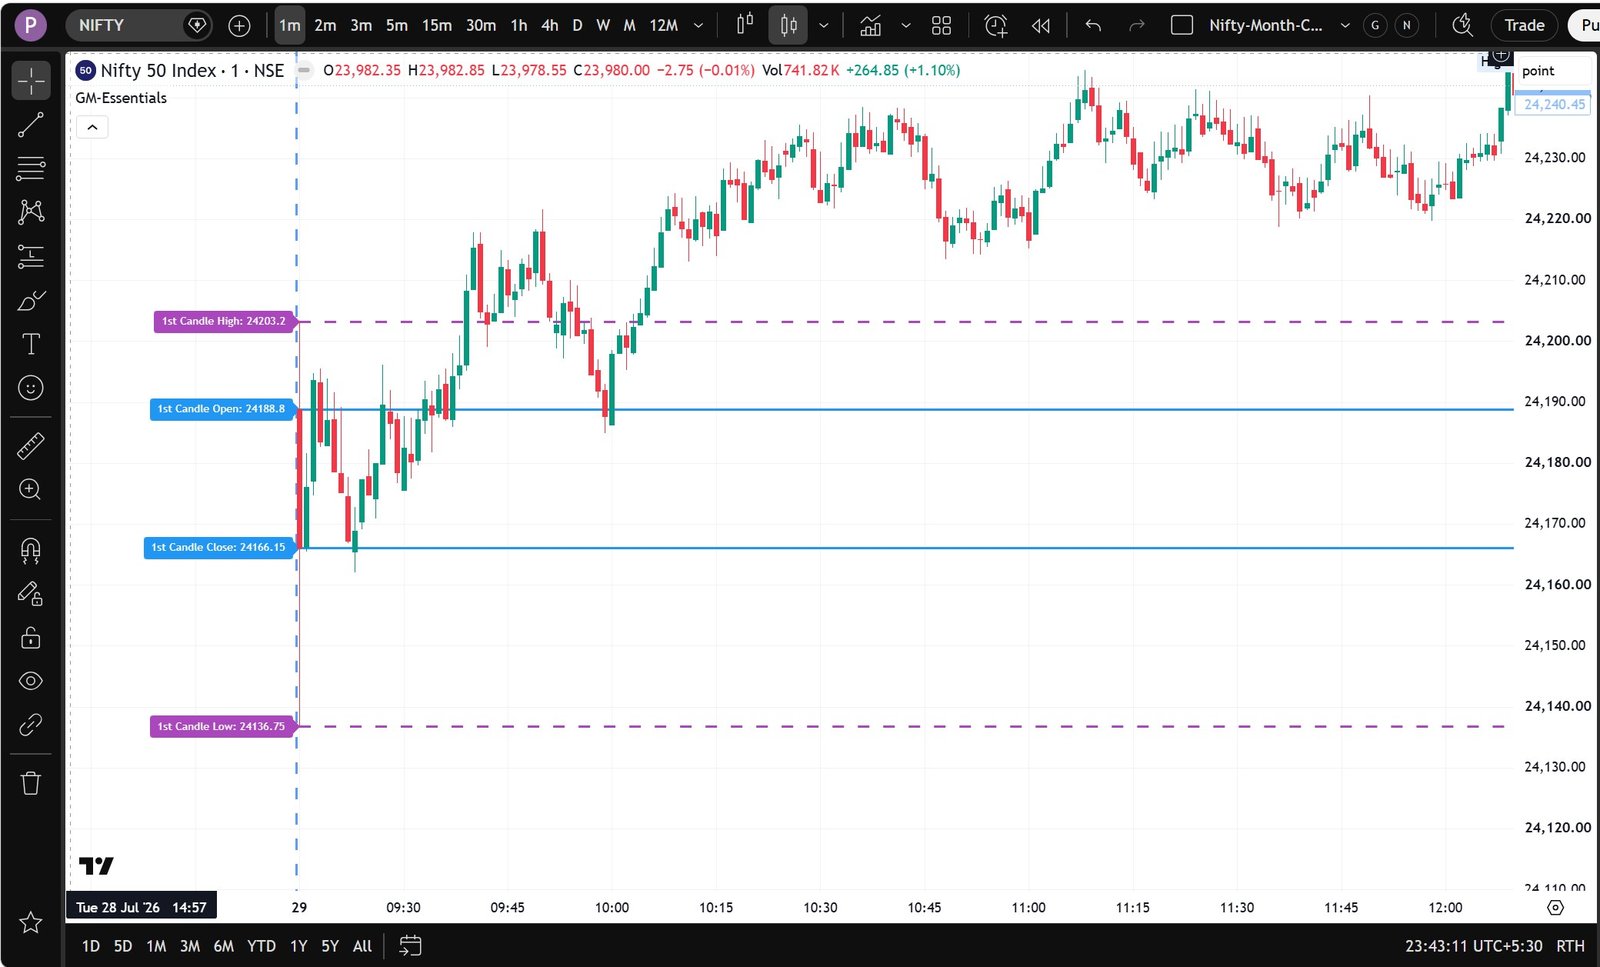
The first candle of each period sets reference levels that hold all session. For intraday traders on NSE that is the 09:15 candle; on a daily chart it is the first trading day of the month; on weekly, the first week of the month. The indicator draws that candle's Open and Close as one pair of lines and its High and Low as a second, separately styled pair — session anchors that price respects repeatedly.
- Intraday: the first candle of today's session (09:15 for NSE)
- Daily chart: the first trading day of the current month
- Weekly chart: the first trading week of the current month
- Monthly chart: the first trading month of the current year
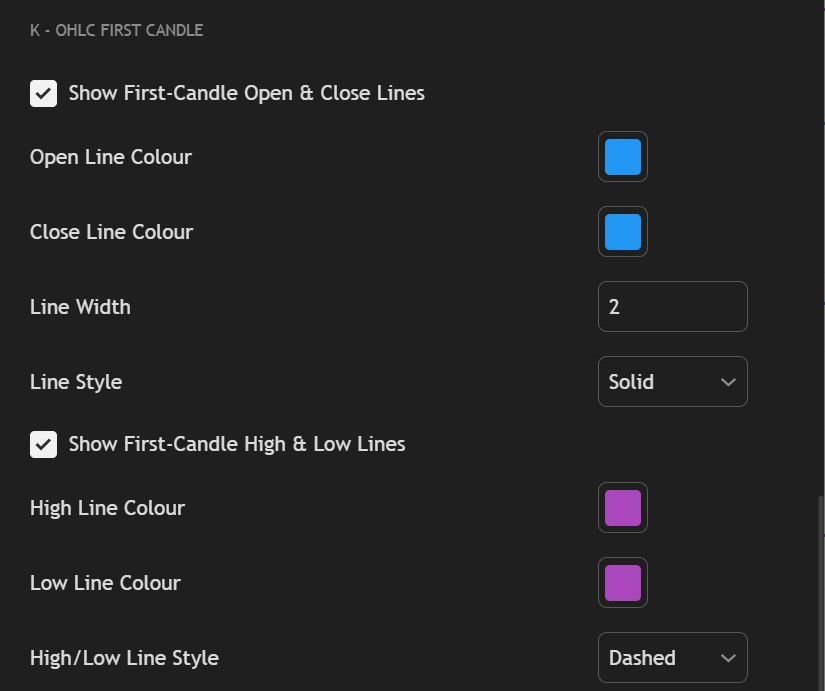
- Open & Close lines — own colours, width and style (solid by default)
- High & Low lines — separate pair, own colours, dashed by default
- Both pairs toggle independently, so you can run either or both
- Period boundaries follow your Group M market session, so it works on NSE, MCX, US, Gold, BTC, LSE, UAE and SGX
Dow Theory + Magic T Confluence Breakout Signals
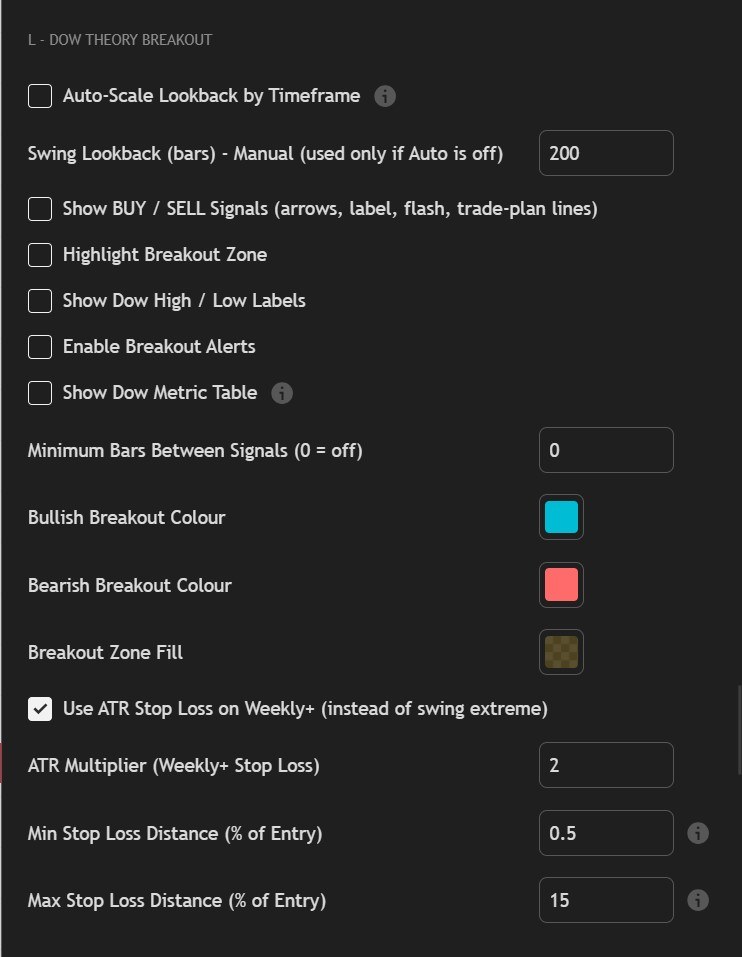
Confirms Magic T's time prediction with real price structure. Pairs Terry Laundry's Magic T time cycle with classical Dow Theory price confirmation, the method built on Charles Dow's turn-of-the-century writings, watching the most recent Dow swing high and low for a genuine break exactly when the projected T-Top is reached. This is a rare, high-conviction signal by design — it fires only when three conditions hold together: (1) the Magic T cycle has actually reached its projected T-Top bar, (2) price closes beyond the most recent Dow swing high or swing low, and (3) no earlier trade is still open. If price is still sitting inside the swing range when T-Top arrives, that cycle is skipped rather than forced into a low-conviction guess. Every signal freezes a complete trade plan — Entry, Stop Loss, Target 1 and Target 2 — at the close of the firing bar. A shaded breakout zone box always shows the current consolidation from T-Centre to T-Top, even when no signal has fired. When all three conditions align the indicator prints a live BUY or SELL signal on your chart — arrow, label, breakout flash and the full Entry / Stop Loss / Target 1 / Target 2 plan — and can raise a TradingView alert so you need not watch the screen. What it does not do is promise an outcome. A structurally valid signal can still fail, which is exactly why the scoreboard counts every stop hit as openly as every target reached. Those figures are historical results on the chart you are viewing, not a projection: past performance does not guarantee future results. These signals are educational analysis tools, not investment advice and not a recommendation to buy or sell.
- Requires Magic T (Group J) enabled — signals, trade plan and scoreboard freeze together without it
- Auto-Scale Lookback by Timeframe (on by default) — 200 bars on fast intraday down to 24 on Yearly; manual override available
- Breakout = a confirmed close beyond the last Dow swing extreme, never a wick
- Show Dow High / Low Labels — marks the exact swing pivots the break is measured against
- Breakout zone box shows current consolidation from T-Centre up to T-Top
- BUY ▲ below bar / SELL ▼ above bar — evaluated on confirmed bar close, so levels never repaint or drift
- Stop Loss from the opposite swing extreme; ATR-based on Weekly+; clamped to a min/max % of entry
- Targets at 1:1 and 1:2 of the entry-to-stop distance
- Dow Metric Table — separates Actual SL Hits from SL After T1 Hits for an honest win rate
- Minimum Bars Between Signals declutters back-to-back cycles; Enable Breakout Alerts toggle
- Expect quiet periods — this is a rare confirmation filter, not a frequent signal
- Signals are educational, never guaranteed — a valid setup can still fail, and the scoreboard shows losses as openly as wins
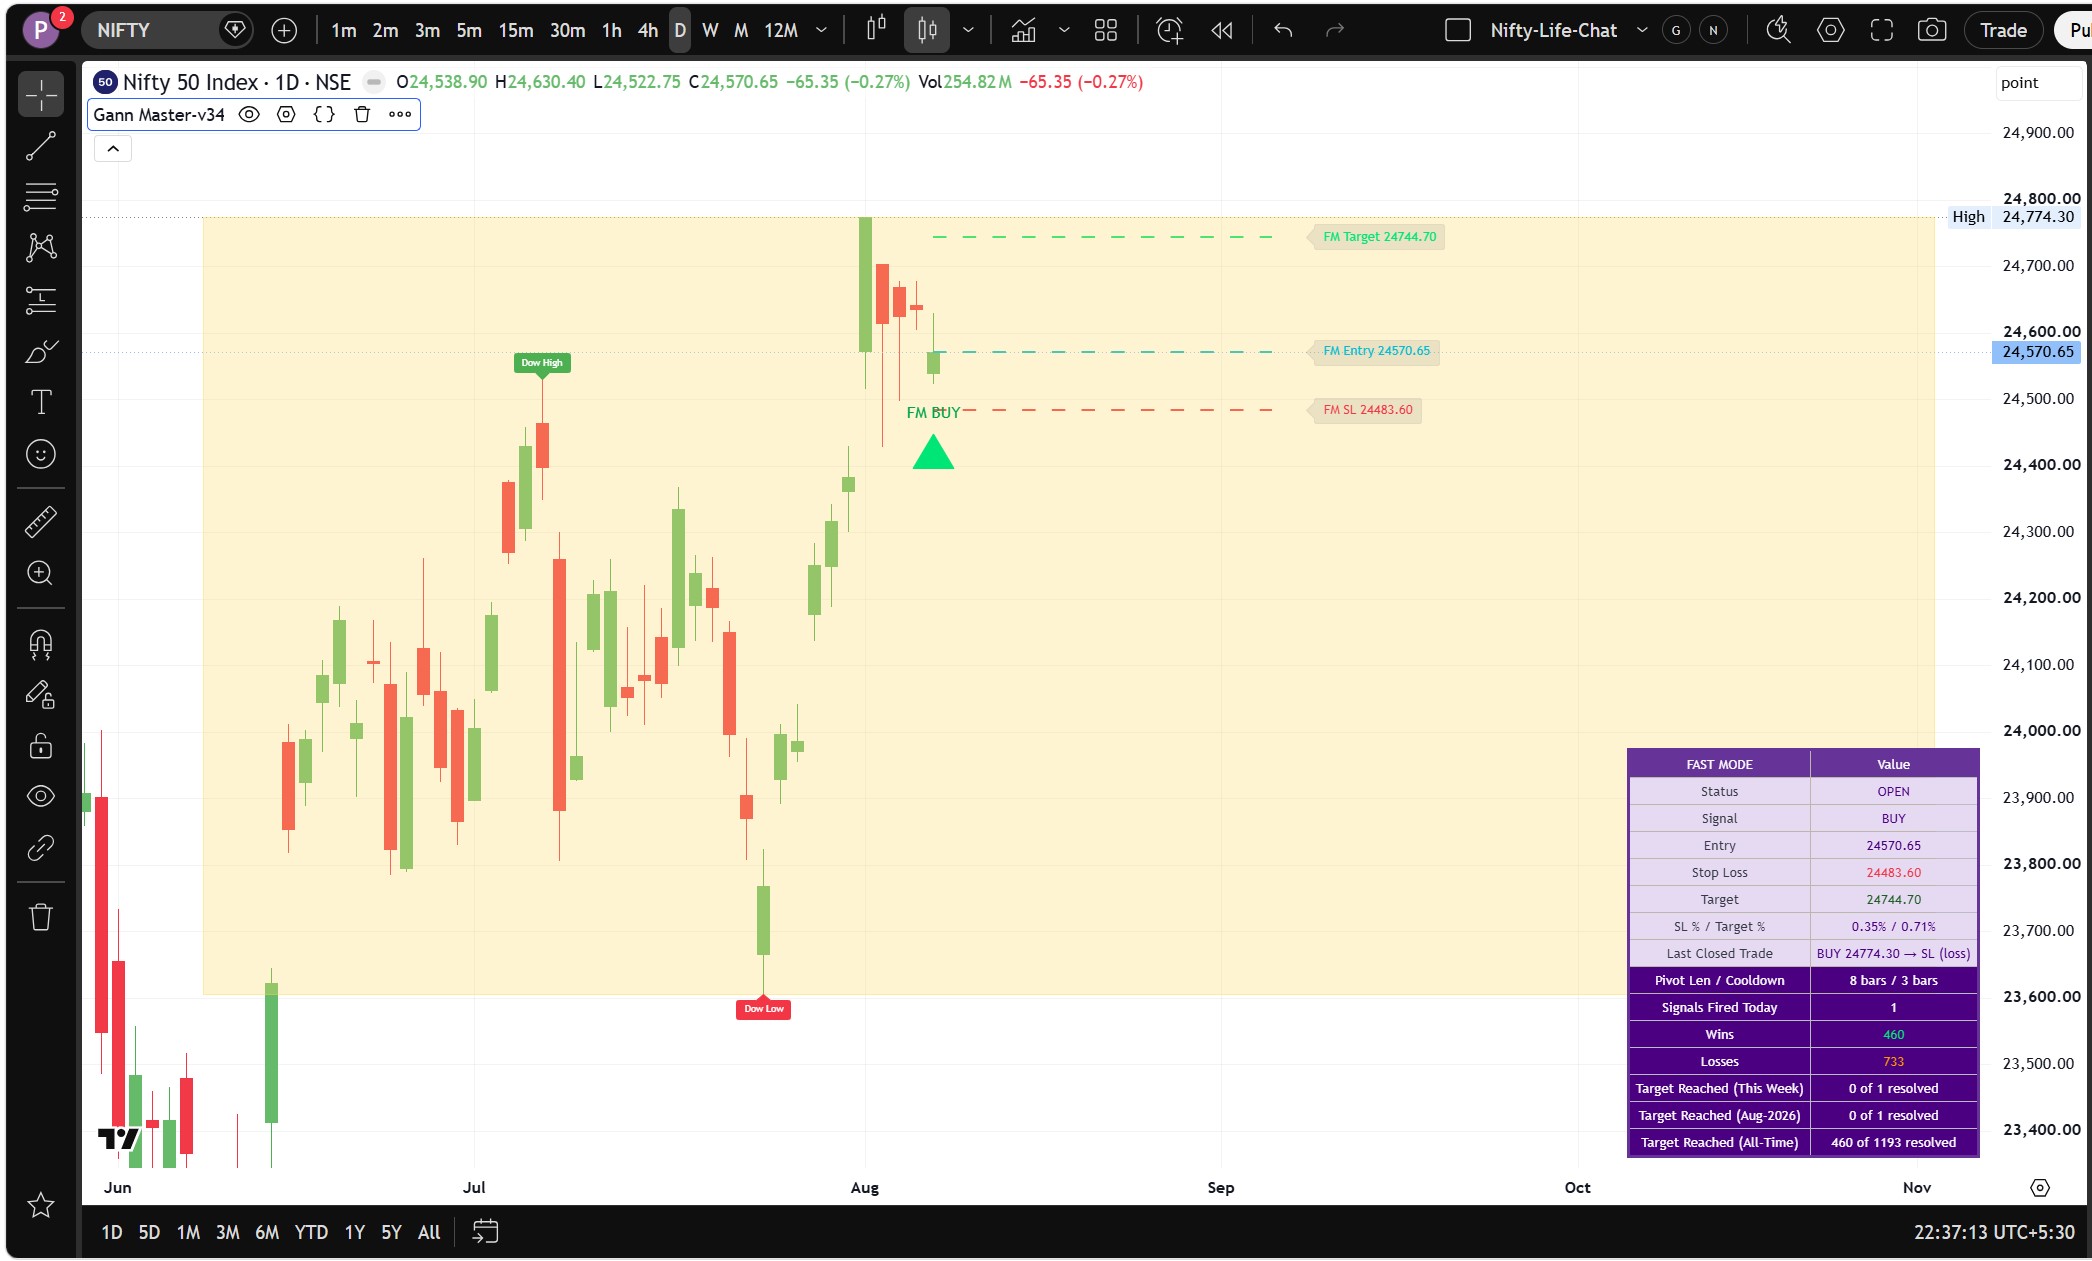
TODAY + YESTERDAY Market Profile with Live Updates
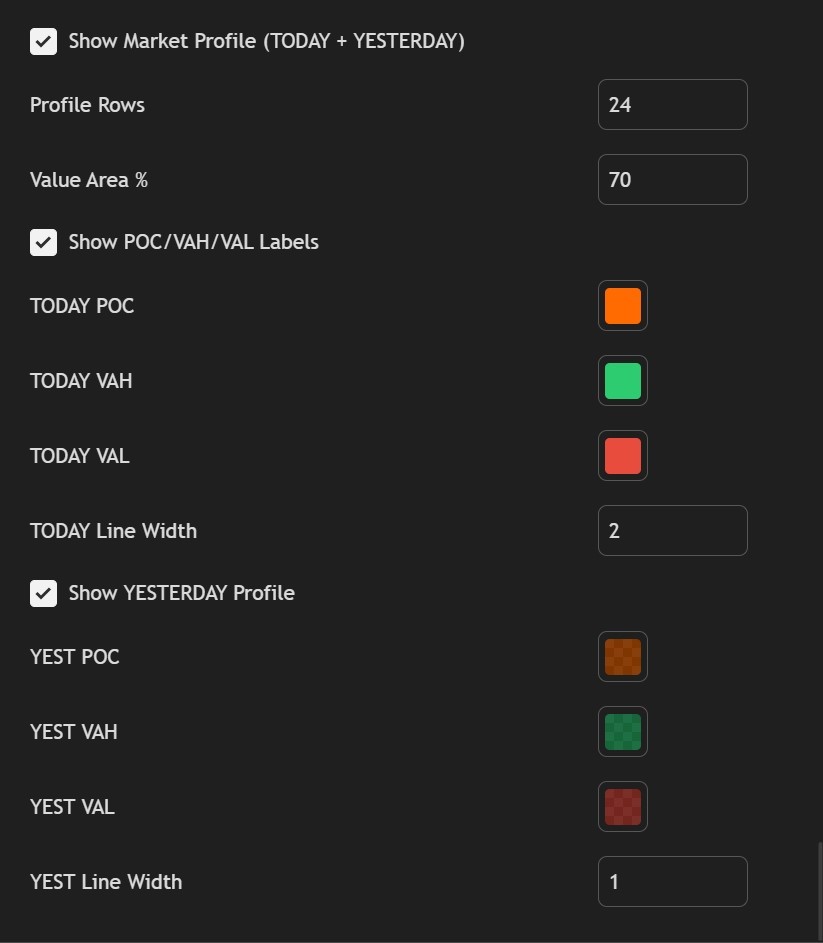
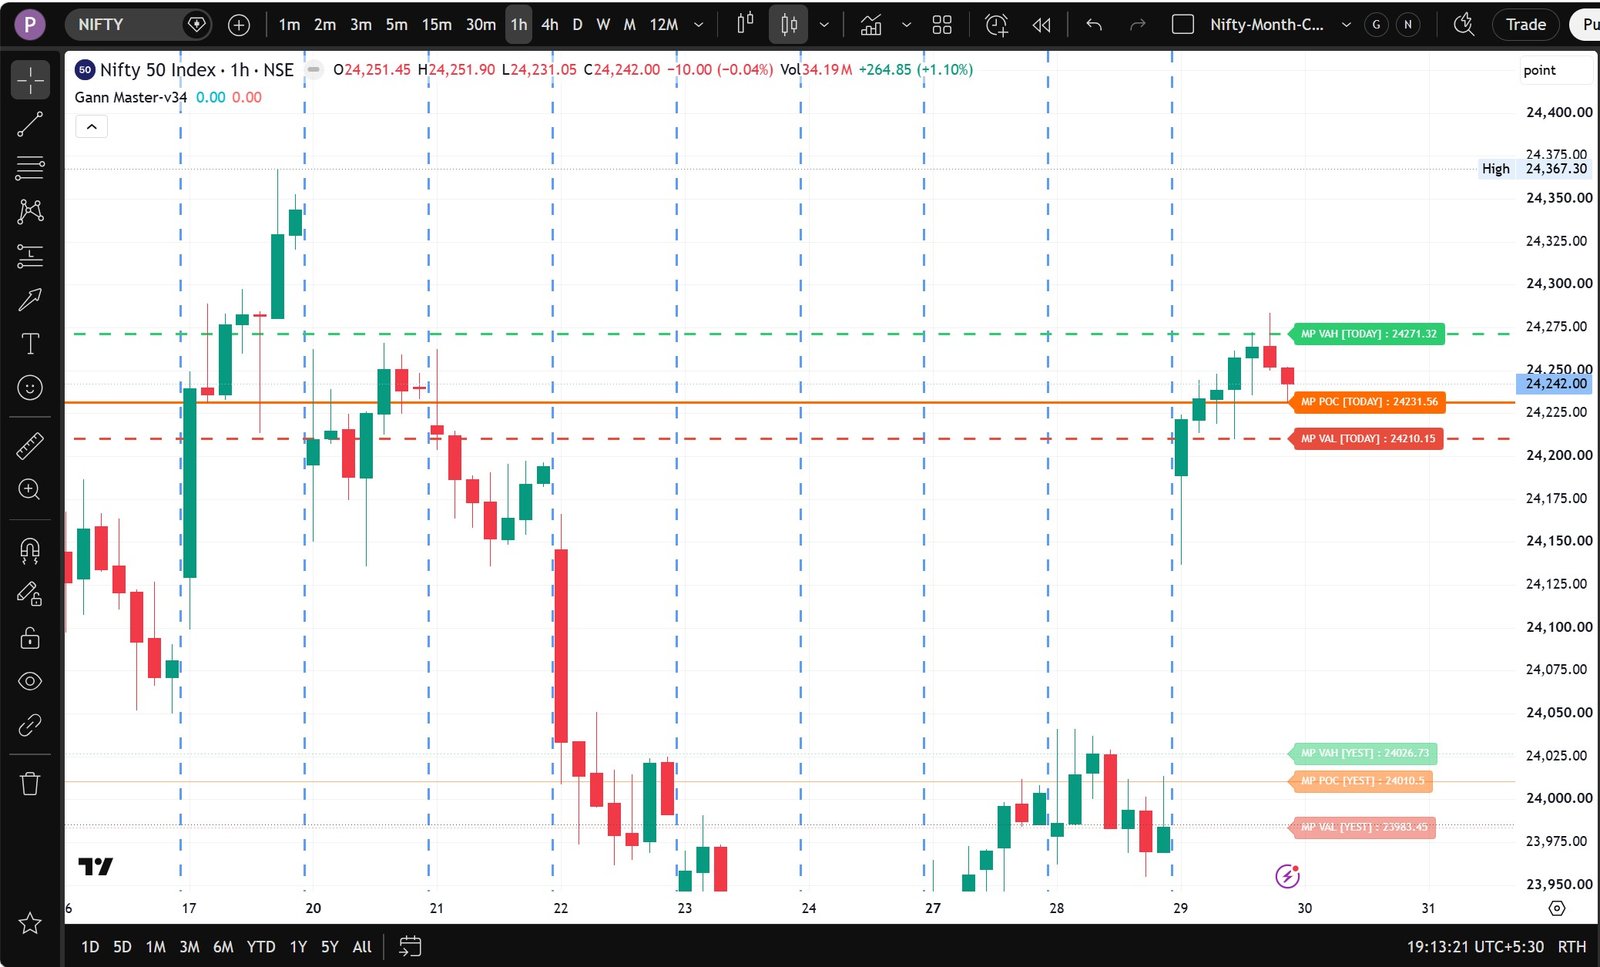
A bar-count Market Profile approximation drawing the Point of Control, Value Area High and Value Area Low for both today's live session and yesterday's completed session at the same time. Today's profile rebuilds in real time on every bar from lower-timeframe data; yesterday's provides static reference levels. Both sets carry independent colours, widths and labels. Off by default — switch it on in Group N.
- Off by default — enable Show Market Profile (TODAY + YESTERDAY) to activate
- TODAY profile: live, rebuilt every bar from lower-timeframe data
- YESTERDAY profile: static reference levels, independently toggleable
- Labels read MP POC / VAH / VAL with [TODAY] or [YEST]
- Value Area %: default 70% (industry standard), adjustable from 50% to 90%
- Profile Rows: default 24 — raise to 40–50 for wide-range days
- Automatic lower-timeframe selection, so it stays safe on 1-minute charts
- Separate POC, VAH and VAL colours plus line width for each of the two sessions
Square of Nine Levels + Gann Fan Angles — Confluence Signal Engine
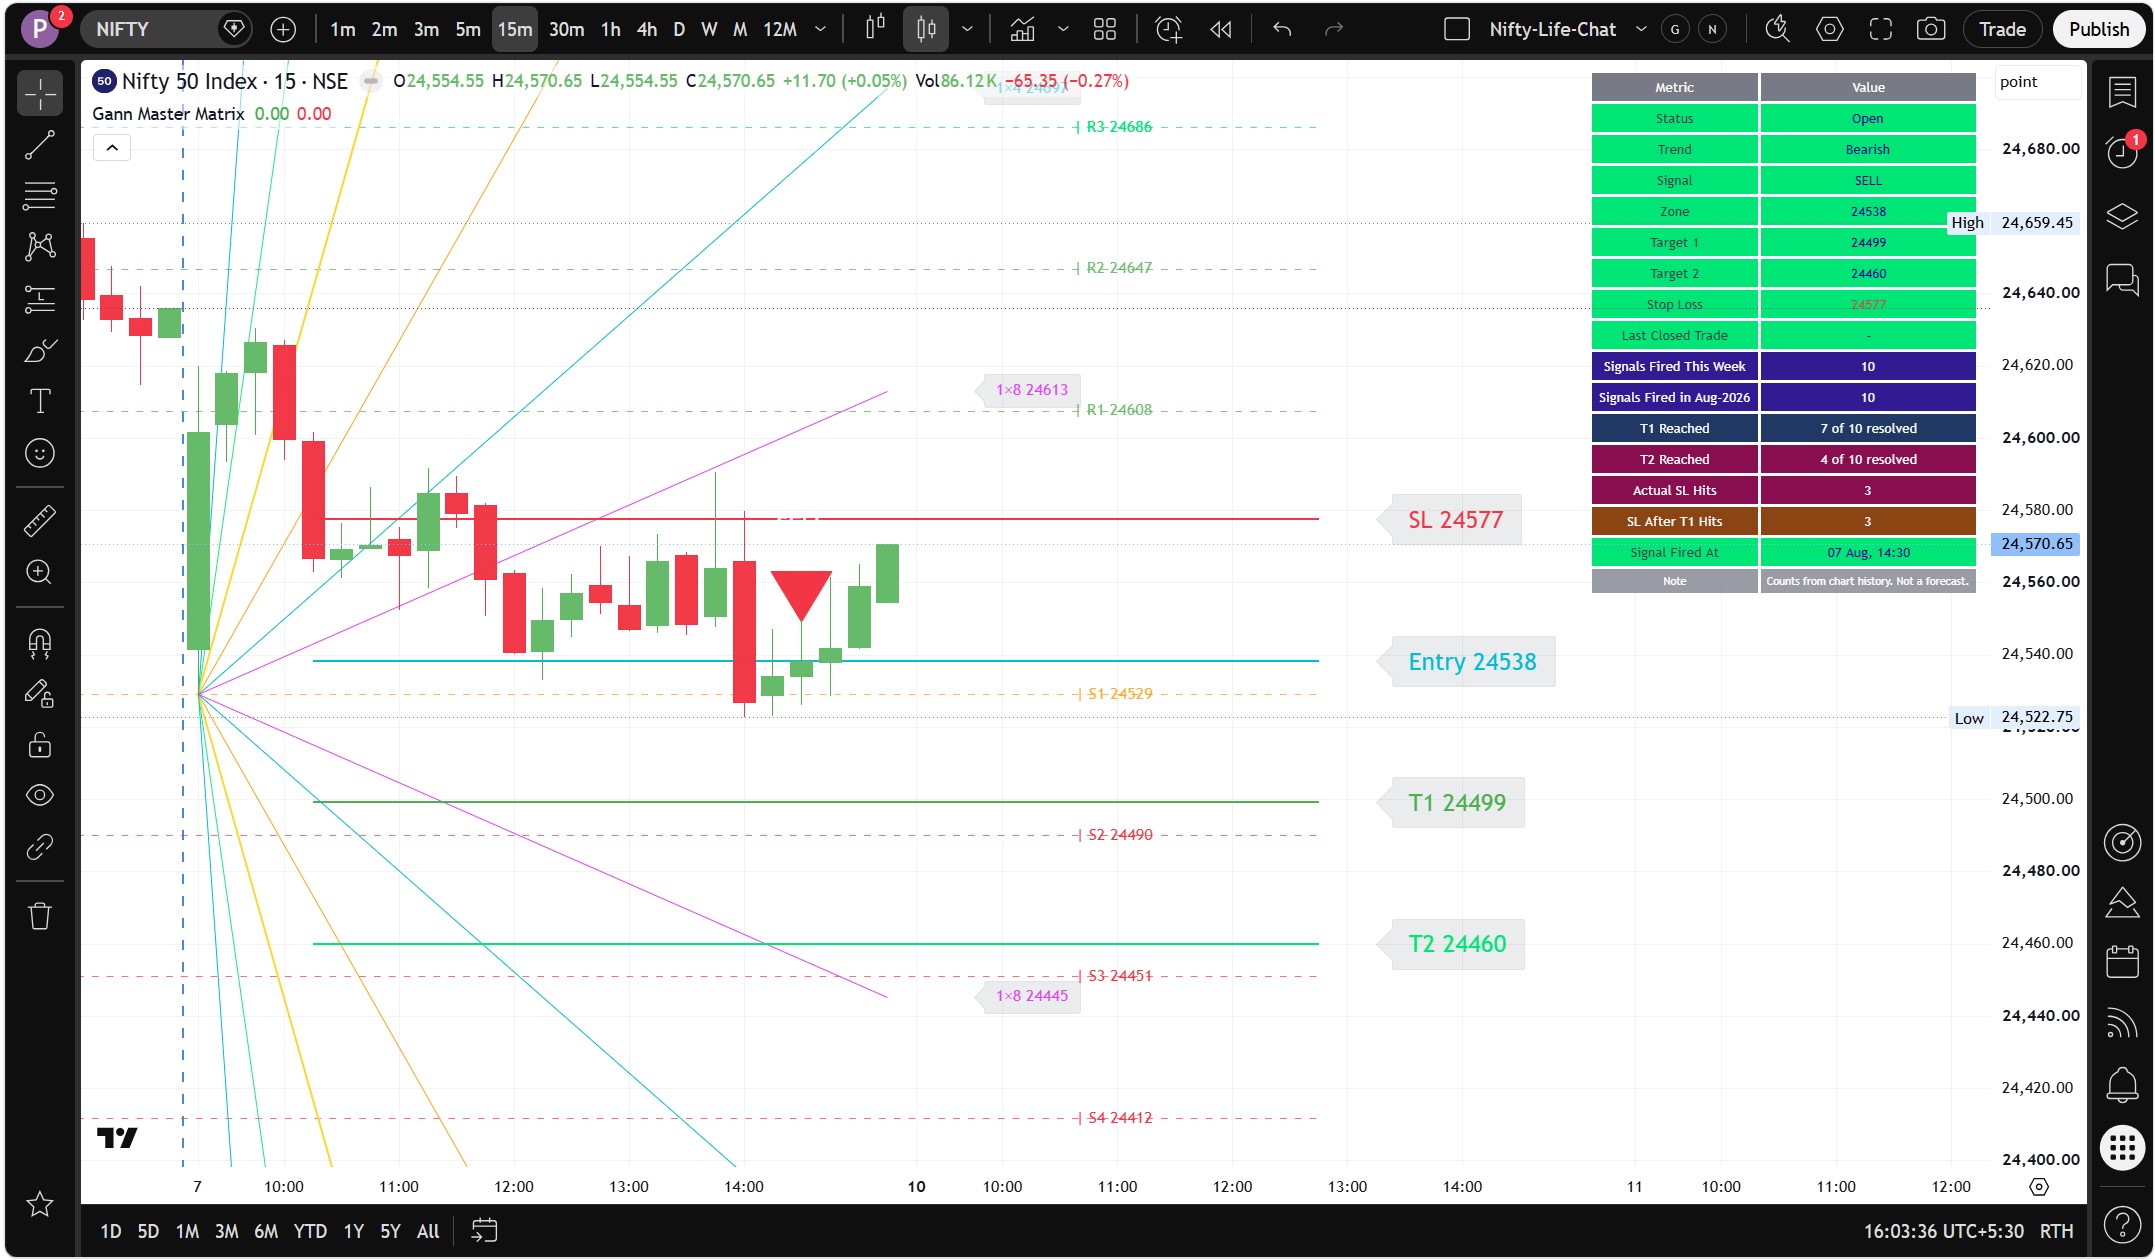
A standalone signal engine that puts two Gann tools to work together. It projects Square of Nine support and resistance levels, then overlays Gann Fan angles radiating from the dominant pivot. Where those two agree, you have confluence — and that is the only place the Matrix will fire. Unlike the Magic T and Dow Theory engines in the Master Suite, the Matrix needs no time cycle at all. It reads price structure alone, which is why it produces signals considerably more often. Every signal arrives as a finished plan: a Zone entry, a Stop Loss, Target 1 and Target 2, printed on the chart and logged in the signal table. That table tracks outcomes openly, keeping trades stopped without ever reaching Target 1 separate from trades that banked Target 1 and were then stopped on the remainder — two very different results that most systems quietly combine. Signals are educational analysis tools and never a guarantee: a valid setup can still fail, the figures shown are historical results rather than a projection, and past performance does not guarantee future results. This is not investment advice or a recommendation to buy or sell.
- Square of Nine levels projected automatically as R1–R4 and S1–S4, each labelled with its price
- Gann Fan angles from the dominant pivot — 1×1, 1×4, 4×1, 1×8 and beyond, each with its own colour
- Signals fire where Square of Nine levels and fan structure agree — confluence, not a single trigger
- Complete trade plan on every signal: Zone entry, Stop Loss, Target 1 and Target 2
- Signal table: Status, Trend, Signal, Zone, T1, T2, Stop Loss, Last Closed Trade and time fired
- Split stop counters — Actual SL Hits kept separate from SL After T1 Hits, so the win rate is honest
- Counter-trend signals are off by default and clearly flagged as risky — enable only if you want them
- Signal Cooldown (default 10 bars) and Max Level Distance % (default 10) filter out noise
- Pivot Length, Fan Scale Factor, ATR Length, line length and S9 label stagger all adjustable
- Target 2 and Stop Loss can each be shown or hidden in the table and in alerts
- Popup alerts, plus the same market session presets used across the suite — NSE, MCX, US, Gold, BTC, LSE, UAE, SGX
- Runs standalone — needs no Magic T cycle, so it produces signals far more often than the Master Suite engines